
With the rise of online shopping, it has become increasingly important for brands to optimize their digital shelf presence to attract and retain customers. To do this effectively, brands must track and analyze key digital shelf metrics to gain insights into their online performance and identify areas for improvement.
In this blog, we will explore the most important metrics that every brand should track to improve their online presence and increase sales. From product availability to customer ratings and reviews, we will equip you with the necessary information, insights and tools you need to optimize your digital shelf and succeed in the highly competitive world of e-commerce. So, let’s dive in and discover the key digital shelf metrics that can help take your brand to the next level!
What is a Digital Shelf?
A digital shelf is a term used to describe a virtual space where a business or e-commerce business displays and promotes its products online. It is a concept used in digital marketing to refer to the online equivalent of a physical store shelf where products are arranged for display.
In the context of e-commerce, a digital shelf refers to a website or online marketplace where products are showcased for potential customers to view and purchase. It is a digital representation of a physical retail shelf where products are displayed in an organized and attractive manner to attract and retain customers.
The digital shelf includes product descriptions, images, and pricing information, and it allows customers to browse, select, and purchase products with ease. A well-organized and optimized digital shelf can help businesses increase sales, attract new customers, and improve customer engagement and loyalty.
Digital Shelf Metrics Every Brand Should Track
There are several key digital shelf metrics that every brand should track to measure the effectiveness of their online presence and identify areas for improvement. Some of these metrics include:
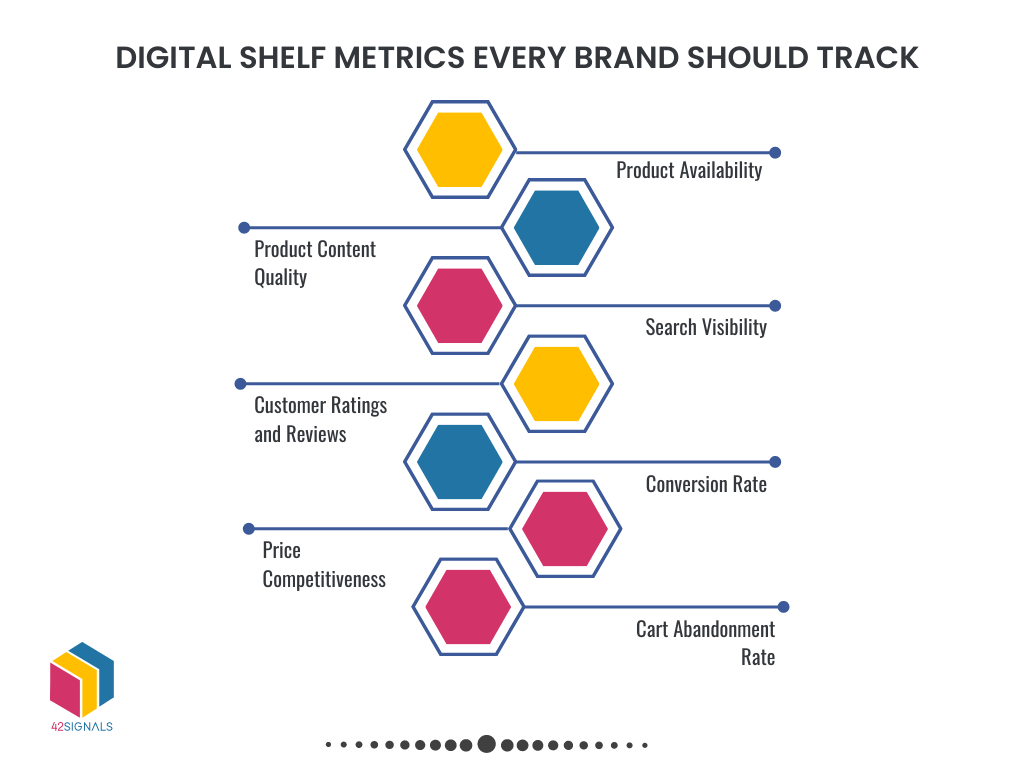
- Product Availability: Tracks the percentage of time a product is available for purchase on the digital shelf. This metric is important because out-of-stock products can lead to lost sales and customer dissatisfaction.
- Product Content Quality: This metric measures the completeness and accuracy of product information such as titles, descriptions, images, and specifications and is important because customers rely on this information to make purchase decisions.
- Search Visibility: Measures how easily a brand’s products can be found in online search results. Brands should track their search ranking for key product keywords to ensure their products are visible to potential customers.
- Customer Ratings and Reviews: The average rating and number of reviews for a brand’s products. Positive reviews and ratings can help increase sales, while negative reviews can have a negative impact on a brand’s reputation.
- Conversion Rate: Measure the percentage of visitors to a digital shelf who make a purchase. Brands should track this metric to identify areas for improvement in the purchase process, such as site speed, user experience, and payment options.
- Price Competitiveness: A brand’s pricing relative to their competitors. Brands should monitor this metric to ensure that their prices are competitive and aligned with customer expectations.
- Cart Abandonment Rate: This metric measures the percentage of visitors who add products to their cart but don’t complete the purchase. Brands should track this metric to identify friction points in the purchase process and optimize their checkout process to reduce cart abandonment.
By tracking these and other relevant metrics, brands can gain valuable insights into their online performance and identify opportunities to improve their online presence and increase sales.
What is Digital Shelf Analytics?
Digital shelf analytics refers to the practice of tracking and analyzing key performance metrics related to a brand’s online presence and product offerings on various digital platforms, such as e-commerce websites, online marketplaces, and social media.
It involves monitoring and analyzing data such as product availability, search visibility, customer ratings and reviews, pricing competitiveness, traffic, and conversion rates to gain insights into a brand’s digital shelf performance and by doing so optimize their digital shelf presence and increase sales.
Digital shelf analytics helps brands to optimize their online presence and improve their e-commerce performance. By tracking and analyzing these metrics, brands can identify areas that require attention and make data-driven decisions to improve their online presence and increase sales. It is a crucial aspect of any e-commerce strategy and can provide valuable insights that help brands stay ahead in a highly competitive market.
How 42Signals Helps
Digital shelf analytics tools like 42Signals provide brands with a range of features to help them track and analyze key digital shelf metrics, gain insights into their online performance, and take action to improve their digital shelf presence. Here are a few ways that brands can use digital shelf analytics tools to track and analyze metrics:
Dashboard Overview: Digital shelf analytics tools typically provide a dashboard overview that summarizes key metrics such as product availability, content quality, search visibility, and more. This allows brands to quickly and easily identify areas that need attention and take action to address them.
Competitor Analysis: These tools enable brands to compare their performance to that of their competitors. This helps brands identify areas where they may be falling behind and take steps to improve their online presence and gain a competitive edge.
Custom Reports: Digital shelf analytics tools allow brands to create custom reports that focus on specific metrics and data points. This enables brands to gain more detailed insights into their digital shelf performance and make data-driven decisions based on this information.
Actionable Insights: Perhaps the most important aspect of digital shelf analytics tools is the ability to gain actionable insights into your digital shelf performance. With these tools, brands can identify areas that need attention, prioritize their efforts, and take action to improve their online presence and increase sales.
Tracking and analyzing key metrics through digital shelf analytics tools like 42Signals can provide valuable insights into a brand’s online performance and help identify areas for improvement and enable brands to make data-driven decisions and take action to improve their digital shelf presence and increase sales.
Frequently Asked Questions
What are the components of the digital shelf? The digital shelf encompasses every touchpoint where consumers interact with a brand’s products online. It’s akin to a virtual aisle where shoppers browse and make purchasing decisions. Here are the key components of the digital shelf:
- Product Information and Content: The foundation of the digital shelf, including product descriptions, specifications, pricing, and availability.
- Primary and Secondary Images: Hero images and other visuals that help shoppers visualize the product from different angles.
- Pricing: Easily accessible pricing information.
- Reviews and Ratings: Influential in consumer decision-making.
- Search Results, Ads, and Product Pages: Everywhere your product can be found through a screen.
- Social Media Accounts and Mobile Apps: Additional channels for engagement.
What is the share of a digital shelf?
The share of shelf is a KPI that measures the volume and visibility of a brand’s products on retail shelves compared to competitors within a category. In the digital context, it refers to how much digital real estate a brand occupies on e-commerce websites. Brands rely on visual diagrams called planograms to compute their share of shelf percentage.
What is digital shelf optimization?
Digital shelf optimization (DSO) is the art of crafting and enhancing a brand’s presence on e-commerce websites. It ensures that products are visible, compelling, and easy to find and purchase. Just as websites are optimized for search engines, brands must optimize their product listings for the algorithms powering e-commerce platforms.
How do you measure share of shelf?
To measure share of shelf, consider the following methods:
- Product Facings: Count how many times a specific item is visible from the front of the shelf. These facings indicate prominence.
- Linear Shelf Space: Measure the linear space occupied by a brand’s products on the shelf.
- Planograms vs. Realograms: Planograms represent the visual layout, while realograms show the actual placement in a store.