Ecommerce has emerged as one of the fastest-growing industries in the world, and India is no exception. According to recent studies, the Indian ecommerce market is expected to reach a whopping US $350 billion by 2030. In such a cut-throat industry where every segment faces intense competition, it’s difficult to stand out or prosper by following outdated methods. This is where ecommerce analytics comes into play.
Ecommerce analytics metrics are crucial for businesses to operate successfully in today’s competitive marketplace. With new technologies and innovative solutions being created to make businesses function better, ecommerce analytics metrics is one such aspect of advanced solutions that can help brands improve their performance by closely monitoring the pulse of the market and the customer. By knowing the latest market trends, competitor strategies, new developments, customer feedback, and sentiments, to name a few, all organizations can refine their strategies and identify areas of improvement.
But where do you start? And what metrics are important to track? These are crucial questions that must be addressed before selecting a tool that matches your needs. Finding the right solution for your business can be less fruitful than intended without knowing the expected outcome and areas to monitor.
In this article, we will take a closer look at the essential ecommerce analytics metrics that can help businesses identify and monitor the key performance indicators (KPIs) that matter the most.
1. Conversion Rate
Conversion Rate (CR) is a crucial metric for businesses as it helps them understand the effectiveness of their sales and marketing strategies. It measures the percentage of users who take a desired action, such as making a purchase or filling out a form, out of the total number of visitors to a website. By tracking conversion rates, businesses can evaluate the success of their website and marketing campaigns, identify areas for improvement, and make data-driven decisions to optimize their website and increase conversions. High conversion rates indicate that businesses are meeting the needs of their customers and providing them with a positive user experience, while low conversion rates suggest that changes need to be made to improve the website and marketing efforts.
A good formula to calculate your conversion rate is –
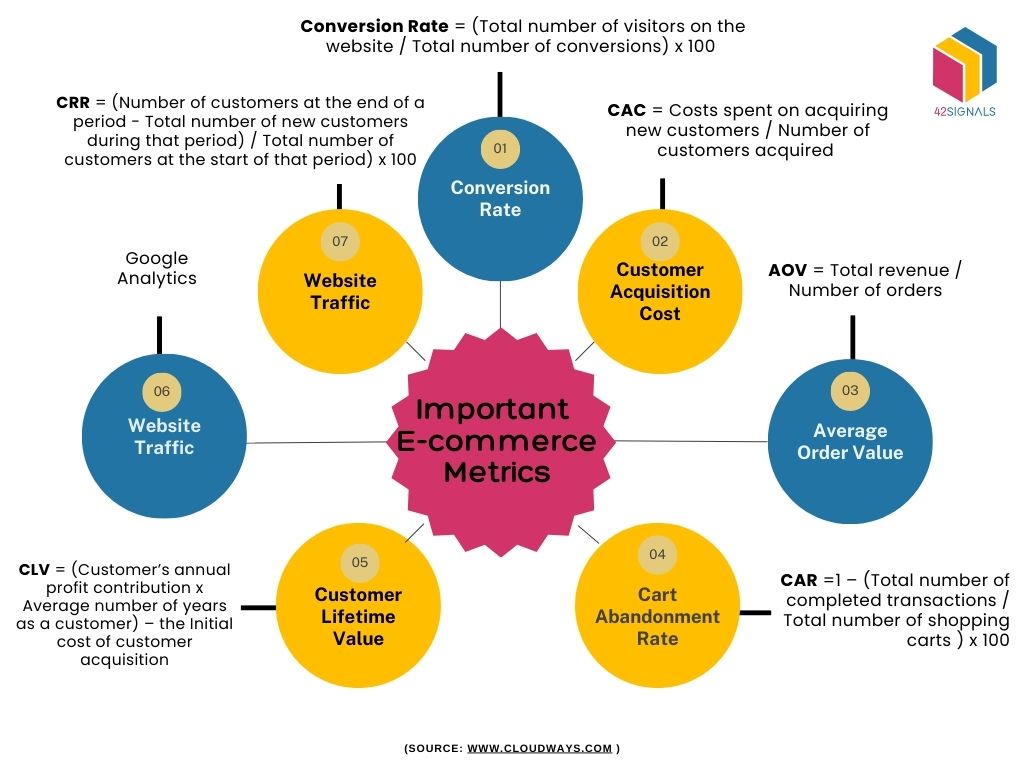
Conversion Rate = (Total number of visitors on the website / Total number of conversions) x 100
2. Customer Acquisition Cost
Customer Acquisition Cost (CAC) is a key metric used by businesses to measure the cost of acquiring a new customer through advertising, marketing, promotions, PR, and other initiatives. The CAC data is critical in identifying areas of spending that do not provide sufficient ROI. By knowing how much money goes into acquiring a customer, businesses can calculate their profitability margins, which is a vital metric to consider. A lower CAC is better, and businesses can adjust different spending to improve their profitability margins.
To calculate your customer acquisition rate, you can use –
CAC = Costs spent on acquiring new customers / Number of customers acquired
3. Average Order Value
The third crucial metric for online businesses is the Average Order Value (AOV). After achieving a good conversion rate and minimizing customer acquisition costs, it’s essential to analyze how much money customers spend on each purchase. The AOV provides valuable insights into which products are popular and which ones are not. A high AOV suggests that customers purchase expensive items in bulk or order multiple products, while a low AOV indicates that they buy only a few, low-priced items. This information helps businesses tailor their pricing strategies, optimize their product ranges, and manage inventory levels.
Average order value is calculated by –
AOV = Total revenue / Number of orders
4. Cart Abandonment Rate
Cart abandonment rate (CAR) refers to the percentage of customers who add items to their online shopping cart but leave the website without completing the purchase. There are several reasons why customers abandon their carts, such as a complicated checkout process, unexpected costs, or a negative user experience. Knowing your CAR can help you identify pain points in the buyer’s journey and make improvements to increase sales. By analyzing data and identifying trends, businesses can optimize their checkout process, adjust pricing strategies, and offer incentives to reduce cart abandonment and improve the overall customer experience.
The formula to calculate the cart abandonment rate is –
CAR =1 – (Total number of completed transactions / Total number of shopping carts ) x 100
5. Customer Lifetime Value
Customer lifetime value (CLV) is a metric that estimates the total revenue that a customer will generate for a business over the entire course of their relationship. It considers various factors such as the frequency of purchases, the average order value, and the duration of the customer relationship. This metric can be used to prioritize customers who make frequent purchases and develop strategies to retain them. Many businesses use this data to create rewards programs, offer special discounts, or personalize their communication to enhance customer loyalty and increase CLV. It is quite an important metric to strengthen company-consumer relationships and grow a loyal customer base.
Customer lifetime value can be calculated by –
CLV = (Customer’s annual profit contribution x Average number of years as a customer) – the Initial cost of customer acquisition
6. Website Traffic
Monitoring website traffic is a crucial metric for businesses as it provides insights into the number of visitors to a website and their behavior. By analyzing this data, businesses can identify trends and patterns in customer behavior and make informed decisions to improve traffic if necessary. Additionally, it helps businesses determine which days of the week have higher visitor volumes, which can be used to tailor marketing and advertising strategies. For example, a business can offer special discounts on high-traffic days to incentivize customers to make purchases, which can ultimately improve the conversion rate.
There isn’t a particular formula for measuring website traffic but tools like Google Analytics help paint a precise picture of your customers and their behavior.
7. Customer Retention Rate
Customer Retention Rate (CRR) is a metric that calculates the percentage of customers who continue to do business with a company over a given period. It’s essential for businesses to focus on building a loyal customer base rather than constantly experiencing a high churn rate and needing to acquire new customers. A high CRR means that customers are satisfied with the products or services offered, and they are more likely to return to the company for future purchases. This metric can help businesses identify areas where they can improve customer satisfaction and loyalty. Retaining existing customers is generally more cost-effective than acquiring new ones, making CRR a critical metric for businesses to track and optimize.
The formula to calculate customer retention is –
CRR = ((Number of customers at the end of a period – Total number of new customers during that period) / Total number of customers at the start of that period) x 100
The infographic provides a visual representation of various e-commerce analytics metrics that businesses should track to improve their online sales performance. It presents a range of metrics such as conversion rate, customer acquisition cost, average order value, cart abandonment rate, customer lifetime value, visitor traffic, and customer retention rate, with their respective formulas for easy calculation.
Conclusion
Tracking these key ecommerce analytics metrics can help businesses adopt the right strategies for 2023. Understanding customer behavior and preferences is crucial in today’s Indian ecommerce market and no brand can achieve success without it. Knowledge of these various metrics helps businesses optimize their website, adjust pricing strategies, and develop targeted marketing campaigns to increase conversions, reduce customer acquisition costs, and improve customer retention.