To reach the goal of $1 million in revenue and a customer base of 100,000 loyal shoppers, takes not only having a good product offering but also knowing the right metrics to track for continuous improvement. That’s where eCommerce analytics platforms come into the picture.
This could include UI/UX changes, an easier checkout process, better prices, more discounts and sales, visibility on other platforms and so on. While this can feel overwhelming or unclear, this checklist will help you understand the important metrics for you to track in eCommerce analytics.

Google Analytics Integration
This is one of the first and foremost steps and a no-brainer. Set up Google Analytics 4 (GA4) for comprehensive site traffic and behavior tracking. It shows how users navigate your website and gives you the right insights to optimize your pages. You can configure goals to track conversions and important interactions too.
Going Deeper:
GA4 is far more than a simple traffic counter in the ecommerce analytics ecosystem. It’s the central hub for understanding the entire customer lifecycle. Proper configuration is critical. Begin by ensuring your GA4 tag is installed correctly on every page of your site, typically via Google Tag Manager for maximum flexibility. The next, non-negotiable step is enabling Enhanced Ecommerce or the GA4 Ecommerce events. This moves you beyond basic page views and into the realm of tracking critical shopping behaviors: product views, add-to-carts, initiation of checkout, promotions, and purchases.
Leverage GA4’s powerful Explorations feature. Create a Funnel Exploration to visualize where users drop off in your checkout process. A high abandonment rate between “Add Shipping Info” and “Add Payment Info” might indicate unexpected shipping costs or a lack of trust in your payment security. Use the Path Exploration tool to see the most common journeys users take, both towards conversion and away from your site. This can reveal unexpected content that assists conversions or dead-end pages that need to be reworked.
Implementation & Review Cadence:
Review Cadence: Your website ecommerce analytics review should be done weekly for the right impact and corrective measures. A weekly review of key metrics like users, sessions, conversion rate, and top landing pages allows for agile responses. However, a more comprehensive monthly deep-dive is essential. This is when you should analyze multi-touch attribution, customer lifetime value (LTV) cohorts, and deeper audience segment performance.
Implementation: This is not a “set it and forget it” task. Dedicate time to properly configure events, conversions, and parameters. Create a measurement plan that aligns with your business objectives.
Customer Segmentation Tools
Implement tools for segmenting customers based on behavior, demographics, and purchase history. This helps understand your audience – their demography, psychography and geography better. Here’s a great list of the tools to get you started.
Going Deeper:
Treating all customers the same is a costly mistake. Segmentation allows for hyper-personalized marketing that dramatically increases engagement and revenue. Basic demographics (age, gender, location) are a start, but behavioral segmentation is where the gold lies.
- High-Value Customers: Identify your top 10% of customers by lifetime value. What was their first purchase? What marketing channel did they come from? Create a lookalike audience based on their profile to find more like them.
- At-Risk Customers: Segment users who have purchased 2+ times but haven’t purchased again in a time frame that exceeds their average purchase frequency. Launch a win-back email campaign offering them an exclusive discount or checking in to see if anything was wrong.
- Window Shoppers: Target users who have viewed a product page multiple times but haven’t added to cart. Serve them a dynamic retargeting ad for that specific product or email them a limited-time offer.
- New vs. Returning: Analyze the different paths these segments take. New visitors might need more social proof and trust signals, while returning visitors respond better to “back in stock” notifications or new arrivals.
Tools like Google Analytics, CRM platforms (like HubSpot or Salesforce), 42Signals ecommerce analytics, and email marketing platforms (Klaviyo, Mailchimp) have powerful built-in segmentation capabilities.
Review Cadence: Depending on the customer base, review your data monthly; spikes in traffic or conversions can also trigger an impromptu review. Customer segments should be dynamic and reviewed quarterly to ensure they are still relevant as your business evolves.
Conversion Rate Optimization (CRO) Metrics
Monitor metrics like cart abandonment rate, conversion rate, and click-through rate. It will help narrow down the possibilities of why things aren’t working.
Going Deeper:
A low conversion rate is a symptom; your job is to find the disease. Cart abandonment rates typically sit between 60-80%; anything higher indicates serious friction.
- Cart Abandonment Rate: Don’t just track the overall rate. Segment it by device (is mobile abandonment significantly higher? That points to a poor mobile UX), by traffic source (do users from Facebook ads abandon more than organic search users? That might indicate misleading ad copy), and by customer type (new vs. returning).
- Micro-Conversions: Track steps before the final purchase. What is your “Add to Cart” rate? A low rate suggests product pages are lacking (poor photos, insufficient descriptions, missing reviews). A high “Add to Cart” rate but a low “Initiate Checkout” rate could mean your cart icon is hard to find or the process isn’t intuitive.
- A/B Testing: Metrics tell you what is happening, but A/B testing tells you why. Use the data from your CRO metrics to form hypotheses. “Because our checkout abandonment is high, we hypothesize that adding more payment options will increase conversions.” Then, test it. Tools like Google Optimize, Optimizely, or VWO are essential for this.
Review Cadence: If your business receives a lot of orders, monitor this weekly. If you’re just starting out, a monthly analysis should be sufficient. However, run A/B tests continuously. The learning never stops.
Performance Tracking of Marketing Campaigns with ECommerce Analytics
Track the performance of different marketing channels (email, social media, PPC). With UTM parameters you can visualize what’s bringing in the traffic and garnering a lot of interest. Analyze open rates, click rates, and conversions from email campaigns with engagement, CTR’s and reach for social media.
Going Deeper:
Discipline in UTM tagging is non-negotiable. A consistent UTM parameter framework (utm_source, utm_medium, utm_campaign, utm_content) allows you to move beyond vanity metrics and see which campaigns are actually driving revenue.
- Beyond Last-Click: In GA4, analyze the Attribution reports. The default last-click model gives all credit to the final touchpoint before conversion. A data-driven model distributes credit across all touchpoints, revealing which channels are great at top-funnel awareness (e.g., social media, blog content) and which are excellent closers (e.g., branded search, email).
- Customer Acquisition Cost (CAC): For each channel (PPC, Facebook Ads, etc.), calculate your CAC. How much did you spend on the channel divided by how many new customers it acquired? Compare this to the LTV of customers from that channel. If CAC > LTV, you are losing money on that channel.
- Email & Social Deep Dive: For email, don’t just look at opens and clicks. Track conversions per send, revenue per recipient, and list growth rate. For social media, track engagement rate (not just likes, but shares and saves) and link clicks, but always connect it back to the on-site conversion data from your UTMs.
Review Cadence: Monitor the metrics of every campaign 2-7 days after it’s been sent and social media traffic weekly. Conduct a full-funnel, cross-channel attribution analysis quarterly to inform your larger marketing budget allocation.
Sales and Revenue Critique
Sales and revenue numbers are the crux of a business operation. Reviewing sales data, average order value, time to convert, revenue trends, and repeat customers can help paint a good picture of your performance with ecommerce analytics.
Going Deeper:
Raw sales figures are a lagging indicator. To forecast and influence future sales, you need to analyze the components.
- Average Order Value (AOV): This is a key lever for profitability. Strategies to increase AOV include: product bundling, “frequently bought together” suggestions, free shipping thresholds, and upselling/cross-selling prompts.
- Customer Lifetime Value (LTV): This is the most important metric for long-term health. How much revenue does an average customer generate over their entire relationship with you? Increasing LTV is cheaper than acquiring new customers. Tactics include subscription models, loyalty programs, and exceptional post-purchase support that builds brand affinity.
- Purchase Frequency: How often does a customer buy from you in a year? Can you increase this through targeted email sequences, new product launch announcements, or replenishment reminders?
Review Cadence: Monitor it monthly and analyze details month-on-month to see changes. Calculate LTV and CAC quarterly, as these metrics require a longer time horizon to be accurate.
Product Performance Tracking
Track best-selling items, product views, and inventory levels to know what brings the customer to your business and what makes them stay. A single best-selling product alone can drive traffic to your website and expose customers to other potential items.
Going Deeper:
Use a simple quadrant analysis to categorize your products:
- Stars: High revenue, high margin. Invest heavily in these. Market them everywhere.
- Cash Cows: High revenue, low margin. These are your traffic drivers. Use them in promotions but be mindful of profitability.
- Question Marks: Low revenue, high margin. Why aren’t these selling? Investigate their product pages, marketing, and placement. Could they become stars?
- Dogs: Low revenue, low margin. Consider discontinuing these or running a clearance sale to free up capital and shelf space.
Also, analyze product affinity (what products are often bought together). This data is invaluable for bundling, cross-selling on product pages, and planning your site architecture.
Review Cadence: Monitor such metrics weekly or monthly depending on the order rates. Conduct a full product portfolio review every quarter.
User Experience (UX) Analytics
Use heatmaps and session recordings to understand user interactions on your site. Knowing the highest visited pages and the most viewed/interacted parts of the website can help optimize those areas to be more effective.
Going Deeper:
Tools like Hotjar, Crazy Egg, or Microsoft Clarity provide qualitative data that explains the “why” behind the quantitative data in GA4.
- Heatmaps: Scroll maps show you how far down users are reading. If 90% of users never scroll past the halfway point on your product page, your key selling points and Add-to-Cart button need to be above the fold. Click maps reveal what users are clicking on, even if it’s not a link (a sign of confusion).
- Session Recordings: Watch real users navigate your site. You will see stalls, confusion, rage clicks (rapid, repeated clicking indicating frustration), and unexpected behavior. This is the fastest way to identify UX bugs and points of friction that you would never find in a spreadsheet.
- Form Analytics: If you have lead gen forms, see which fields have the highest abandonment rates. Perhaps users don’t want to give their phone number, or the address field is too complicated.
Review Cadence: Monitor this data monthly and it can be clubbed with Google Analytics to provide a holistic view. Set up filters in your session recording tool to watch recordings of users who dropped off at key funnel steps.
Customer Feedback Monitoring with ECommerce Analytics
Collect and analyze customer feedback for insights into satisfaction and areas for improvement. A lot of negative feedback on a specific issue should warrant immediate action to resolve that friction point. Likewise, what’s very positive can be set as a benchmark for standards.
Going Deeper:
Go beyond just product reviews. Implement post-purchase surveys (e.g., using Net Promoter Score – NPS) to measure loyalty. Ask open-ended questions like “What nearly stopped you from buying today?” or “What can we do to improve?”.
Monitor social media mentions and comments for unsolicited feedback. Use text analysis tools to categorize feedback into themes (e.g., “shipping,” “quality,” “website difficulty”). A cluster of comments about slow shipping is a clear operational signal. A cluster about difficulty finding a product is a website navigation issue.
Review Cadence: This can be done either on an ad hoc basis or every two months to ensure nothing’s missed. However, set up real-time alerts for negative reviews or a sudden drop in NPS so you can react immediately.
SEO Performance Monitoring
SEO is the backbone of organic traffic and its importance cannot be downplayed. Regularly review search rankings, organic traffic, and keyword performance to see your brand’s performance and compare it with competitors.
To know more, have a look at these insights derived from eCommerce data helping businesses improve their practices.
Going Deeper:
Use Google Search Console (GSC) in tandem with GA4. GSC tells you what queries you are appearing for, your average position, and your click-through rate from search results.
- Keyword Gap Analysis: Use tools like Ahrefs or Semrush to identify valuable keywords your competitors rank for that you don’t. This is a direct roadmap for content creation.
- Technical SEO: Regularly audit your site for errors. Check for broken links (404 errors), pages that are index but shouldn’t be (noindex), and ensure your site is mobile-friendly and fast. Google’s Core Web Vitals (loading, interactivity, visual stability) are now a ranking factor and directly impact user experience.
- Content Performance: Which blog posts or landing pages are driving the most organic traffic and conversions? Double down on that topic. Which pages have high impressions but low clicks? This suggests your meta title and description are not compelling enough for the query.
Review Cadence: SEO is a long game. Monitor rankings and traffic weekly, but conduct a full technical and content audit quarterly.
Conclusion on ECommerce Analytics
While these metrics may look like a lot, scheduling regular reporting to analyze trends, measure growth, and inform strategy adjustments can make a huge difference.
Remember, the key to mastering your online store is not just in setting up these analytics but in regularly reviewing and acting on the insights they provide. This knowledge can be priceless in helping your business reach its true potential.
FAQs on ECommerce Analytics
Which eCommerce Analytics Tool is the Best and Why?
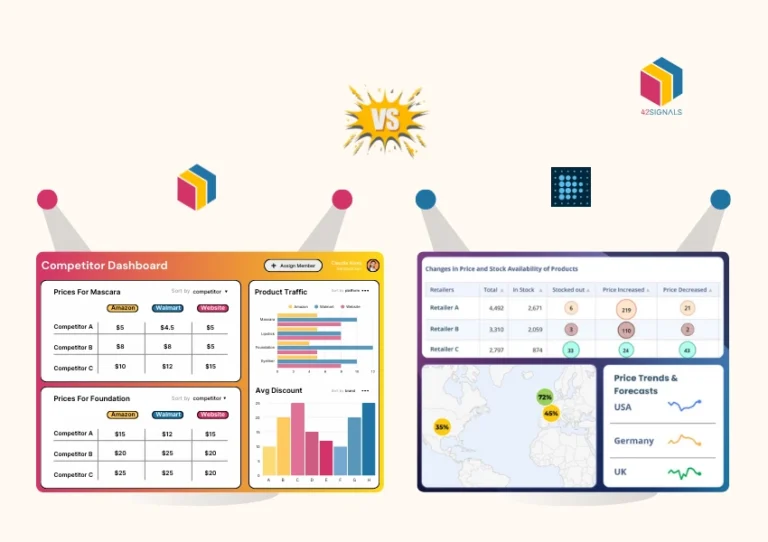
The “best” eCommerce analytics tool often depends on the specific needs of your business, including the size of your eCommerce operation, the complexity of the data you wish to analyze, and your budget. However, a commonly recommended tool is Google Analytics. For granular insights specific to products, competitors and customers, 42Signals is a great fit.
What are the Best eCommerce Analytics Tools?
Several eCommerce analytics tools are highly regarded in the industry, each offering unique features. Some of the best include:
- Google Analytics: Ideal for a broad range of analytics needs, offering both a free and a premium version.
- Kissmetrics: Known for its customer-centric approach, it provides detailed insights into individual customer behaviors and is excellent for understanding customer journeys and improving conversion rates.
- Adobe Analytics: Part of the Adobe Marketing Cloud, it’s a powerful tool for larger businesses with more complex data analysis needs. It excels in segmenting and visualizing data.
- Mixpanel: Focuses on tracking user interaction with products. It’s particularly useful for mobile analytics and tracking events.
- Woopra: Known for real-time analytics and customer journey tracking. It’s excellent for businesses focused on optimizing the customer experience.
- Shopify Analytics: For businesses using Shopify as their eCommerce platform, Shopify Analytics is a tailored solution that integrates seamlessly with the platform.
- BigCommerce Analytics: Similar to Shopify Analytics, this is ideal for BigCommerce users, offering insights specific to the platform.
- 42Signals: Great for competitor research, market insights, product availability, quick commerce data and more.