Brands today have no shortage of numbers to track – from page views and clicks to social media likes. Yet not all of these figures translate into business growth. The challenge is to sift through ecommerce analytics and zero in on the product performance metrics that actually matter for brand growth. Effective product performance analysis means focusing on the KPIs that drive revenue, customer loyalty, and market share, rather than getting distracted by vanity metrics.
A key part of this analytical focus involves understanding the “digital shelf.” Let’s understand more about what metrics matter and focus on the important ones.
Why Focus on Product Performance Metrics?
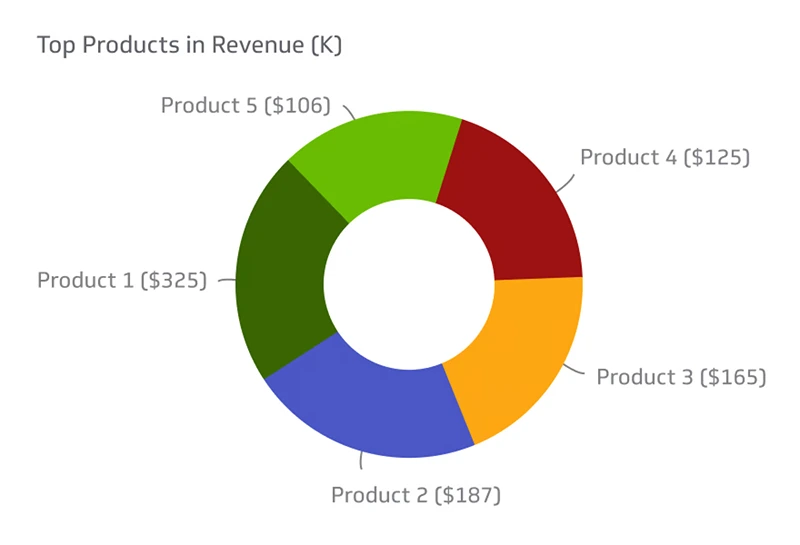
Image Source: Klipfolio
Understanding and acting on the right metrics can make the difference between stagnation and rapid brand growth. High-level figures like total sales or site traffic are valuable, but they don’t tell the whole story. It’s often a handful of standout products that drive a disproportionate share of revenue – for many brands, about 20% of products contribute around 80% of sales
If you’re not drilling down into product-level performance, you might miss critical insights. For example, one top-selling item might be carrying your growth, while another product with potential is languishing due to a low conversion rate or poor visibility.
By conducting detailed product performance analysis, companies can identify these patterns and respond strategically. As BigCommerce experts note, many e-commerce teams fixate on broad metrics (overall visitors, total revenue) when “there is a lot to be learned” from product-level insights.

These granular analytics shine light on what’s actually working at the product level. Knowing which product pages convert best, which items get repeated purchases, or which listings suffer high return rates allows managers to take targeted action – whether that’s doubling down on a winning product, reworking a description, adjusting pricing, or fixing a quality issue.
In short, focusing on the metrics that matter enables data-driven decisions that directly impact growth.
Moreover, aligning your team around key product performance metrics encourages cross-functional collaboration. Marketing can optimize campaigns for products with high potential, merchandising can ensure popular items stay in stock, and customer support can flag recurring product issues hurting reviews.
1. Conversion Rate – Turning Browsers into Buyers
Conversion rate is arguably the most critical product performance metric in e-commerce. A high conversion rate means that your product detail pages (PDPs) are effectively convincing shoppers to add to cart and check out, which directly boosts revenue without requiring more traffic.
Small improvements in conversion rate can have outsized effects on growth. Optimizing page elements – from high-quality images and descriptions to easy-to-find reviews – pays off in more sales. For example, fashion retailer ASOS increased its conversion rate by 20% after adding customer reviews and detailed size guides to its product pages
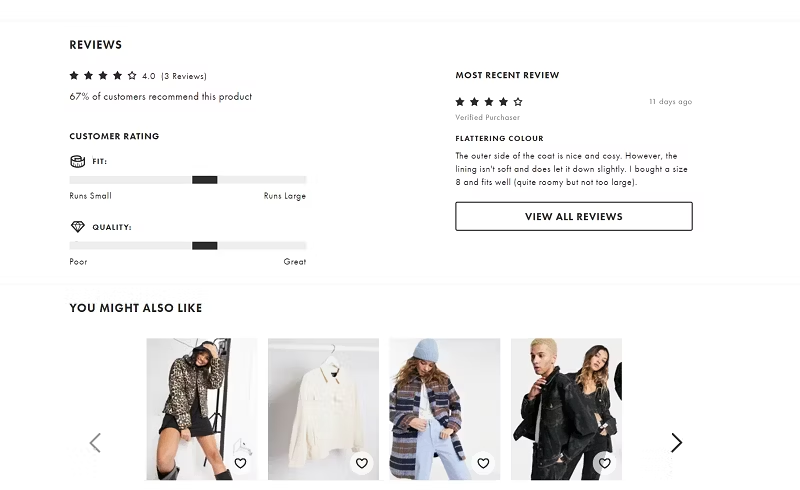
Image Source: Econsultancy
It’s also important to monitor the flip side of conversion: cart abandonment. Analyzing where customers drop off in the funnel is part of product performance analysis.
Many brands use ecommerce analytics to track cart abandonment rate as a related KPI – the lower, the better. Overall, by continually measuring and improving conversion rates, e-commerce brands can significantly accelerate their growth.
2. Average Order Value (AOV) – Maximizing Basket Size
Average Order Value represents the average dollar amount each customer spends per transaction. Simply put, it’s your total revenue divided by the number of orders. A higher AOV directly boosts your bottom line – if each customer buys more, you earn more without needing to acquire additional customers.
This metric reflects how well you engage customers to purchase additional items or higher-priced options.

Brands that master AOV tend to excel at cross-selling and upselling. They use digital shelf analytics and shopper data to recommend complementary products and encourage larger baskets. One textbook example is Apple. When you buy an iPhone on Apple’s online store, you’ll be prompted to add accessories like AirPods or coverage like AppleCare. Apple effectively boosts its AOV by suggesting these add-ons during checkout
The result is that many customers leave with not just a phone, but also extra products or services – increasing the value of the sale.
Another common strategy is offering free shipping or discounts at a certain cart value threshold (e.g. “Free shipping on orders over $50”), which motivates customers to spend a bit more to qualify.
Analyzing ecommerce data can reveal the optimal thresholds and product pairings to maximize basket size. By monitoring AOV and testing different promotions or recommendations, e-commerce brands can steadily increase how much each customer spends, fueling higher revenue growth without necessarily increasing traffic.
3. Customer Retention and Repeat Purchases – The Loyalty Factor
Winning a customer once is great; winning that customer’s ongoing loyalty is even better. Repeat purchase rate (the percentage of orders coming from returning buyers) is a key indicator of customer retention. If shoppers come back to buy again, it signals satisfaction with the product and the brand.
This metric matters immensely for growth because retaining customers is far more cost-effective than acquiring new ones – and returning shoppers tend to spend more over time. In fact, research shows that increasing customer retention by just 5% can boost profits by 25% to 95%.
Repeat customers often have higher lifetime value, providing a reliable revenue base for the brand.
Analyzing repeat purchase behavior at the product level can uncover which items have a loyal following versus which are “one-and-done” purchases.
For example, a consumable product (like a skincare serum or a nutritional supplement) with a high repeat purchase rate might justify a subscription program or bulk-buy discount, further cementing customer loyalty.
On the other hand, if a supposedly replenishable item has low repeat sales, product performance analysis might investigate whether quality issues or strong competitors are driving customers away.
Brands with strong retention strategies leverage ecommerce analytics to identify and reward their most loyal customers with voice of customer analytics. Tactics such as loyalty points, personalized re-engagement emails, or subscriptions (e.g. “subscribe and save” programs) can significantly lift repeat sales. The end goal is to turn one-time buyers into regular customers.
Not only do repeat purchases signal a healthy product–market fit, they also transform satisfied buyers into brand advocates who fuel organic growth through word-of-mouth. In summary, a rising repeat purchase rate is a powerful engine for sustainable e-commerce brand growth.
4. Product Page Traffic and Visibility – Feeding the Funnel in Product Performance
Before a product can convert or drive revenue, it must be seen. Metrics that gauge visibility, such as product page views, impressions, and search result ranking, are top-of-funnel indicators for e-commerce performance. If a product isn’t surfacing in front of shoppers (whether via your website’s navigation, internal search, or on external marketplaces), it has no chance to sell.
Achieving a high share-of-search on relevant keywords translates directly into more eyeballs on your product pages.
Optimizing for these visibility metrics involves a strong product content and SEO strategy. This includes using relevant keywords in titles and descriptions, having robust and accurate product information, and meeting each retailer’s content requirements so your listings aren’t suppressed.
One real-world example underlines the impact: a major beauty brand discovered that competitors were ranking for certain high-volume search terms the brand had overlooked.
After they scraped product data to identify those top-searched keywords, the brand added them to its product copy. The result was an annualized revenue increase between $144,000 and $334,000– purely from improved search visibility driving more traffic to their pages.
Traffic metrics aren’t just about search engines either. Brands should analyze which channels funnel visitors to product pages (organic search, paid ads, social media, email, etc.) and how those visitors behave.
For instance, beauty retailer Glossier leverages Instagram and influencer marketing to drive significant traffic to its online store, resulting in high conversion rates for the products showcased.
Knowing where your audience comes from helps you allocate marketing efforts more effectively. Overall, tracking and improving product page traffic is a fundamental step – it “fills the funnel” so that your other metrics like conversion rate can play their part in generating sales.
5. Customer Satisfaction – Reviews, Ratings, and Return Rates
In e-commerce, what customers say after purchase is just as important as what they do before purchase. Product ratings, written reviews, and return rates are vital performance indicators that reflect real-world product quality and customer satisfaction.
A product with a stellar average rating (say 4.5 out of 5) and glowing reviews will build trust with new shoppers – in fact, positive reviews compel purchases more than any other single factor
Conversely, a stream of poor ratings or complaints will send potential buyers running, and can quickly tank a product’s sales.
Monitoring reviews and ratings is thus non-negotiable. Brands should track the average star rating and volume of reviews for each product, and dig into the content of those reviews for recurring praises or issues. Many companies now use AI-driven text analysis to gauge review sentiment at scale.
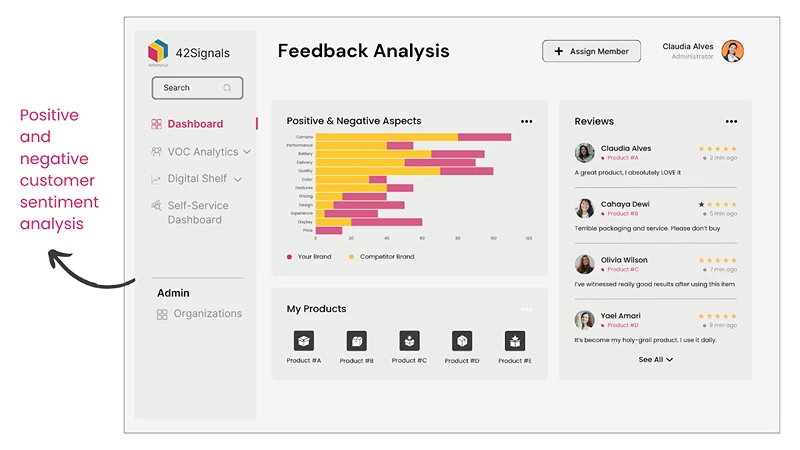
For example, Samsung uses sentiment analysis tools to monitor customer feedback and then adjusts product features or marketing strategies accordingly. By systematically listening to online feedback, Samsung can identify pain points (e.g. a frequently criticized feature) and address them to improve the product and its perception.
Return rate is another telling metric.
If a high percentage of customers are sending back a particular item, that’s a red flag that something is off – maybe the item doesn’t match its online description, has quality defects, or fails to meet expectations.
Tracking returns at the product level helps isolate these problems. A high return rate hurts profitability and customer goodwill. But by analyzing return data alongside reviews (which often explain why an item was unsatisfactory), a brand can take corrective action – updating the product information, improving manufacturing quality, or even discontinuing an item that isn’t working out.
Ultimately, healthy review scores and low return rates indicate a strong product-market fit, which drives growth through repeat business and positive word-of-mouth.
6. Inventory Availability in Product Performance – Never Miss a Sale
Stockouts leave shelves (physical or digital) empty, resulting in missed revenue and frustrated customers.
Product performance isn’t just about demand-side metrics; supply-side factors like inventory availability are equally crucial.
An item can have strong traffic and conversion, but if it’s out of stock when customers want to buy, the sale is lost — and worse, you may lose the customer for the future. Inventory availability (often tracked as an “in-stock rate” or as the frequency/duration of stockouts) is a metric that directly affects revenue and customer satisfaction.
Frequent stockouts can seriously stunt e-commerce growth. Industry studies estimate that the global retail sector loses around $1.75 trillion in sales each year due to out-of-stock products
In other words, failing to keep popular products available can send shoppers straight to competitors and erode your brand loyalty.
Leading e-commerce players treat inventory metrics as sacrosanct. For instance, Amazon uses advanced algorithms and predictive analytics to manage inventory levels and reduce the risk of stockouts, ensuring that popular items are almost always available.
By closely monitoring sales velocity and stock on hand, Amazon can replenish products just in time to meet demand. Every brand may not have Amazon’s scale, but tools like real-time inventory tracking, alert systems for low stock, and demand forecasting can help any e-commerce operation improve its in-stock performance.
The goal is to strike a balance – prevent stockouts without grossly overstocking (which ties up capital and can lead to markdowns). A good practice is to set target in-stock rates for your key products (for example, 99% availability for your top sellers) and treat stockout incidents as urgent issues to address.
By treating inventory availability as a key performance metric, you ensure that high demand for your products consistently translates into actual sales, not missed opportunities. Keeping products reliably in stock preserves customer trust and contributes significantly to repeat business and brand growth.
Conclusion on Product Performance Metrics
It’s important to remember that these metrics are interconnected. A change in one can ripple through to others: improving product content might boost traffic and conversion; better reviews may increase repeat purchases; fixing stock availability can immediately lift sales and even conversions (as customers learn your site is reliable). Successful brands treat this as an ongoing cycle of ecommerce analytics: measure, analyze, optimize, and repeat.
They leverage modern tools – from digital shelf analytics platforms that monitor their product’s online shelf presence to web scraping solutions that gather competitive product data – to stay informed in real time and act on insights.
Maintaining a formal yet customer-centric approach to metrics ensures you never lose sight of the end goal: delighting the customer. After all, metrics are not just numbers on a dashboard; they represent real customer behaviors and opinions.
Focusing on the metrics that matter keeps your team aligned on delivering great products and experiences. In doing so, you build a strong foundation for sustainable e-commerce brand growth – growth that is supported by data, driven by insight, and validated by the satisfaction and loyalty of your customers.
Sign up for a free trial to see how 42Signals can give you the data that you need.
Frequently Asked Questions
What is the meaning of product performance?
Product performance refers to how well a product meets its intended purpose and customer expectations. It encompasses factors such as functionality, reliability, durability, customer satisfaction, and commercial success (like sales and profitability).
In business terms, product performance can also reflect how a product contributes to a company’s goals, whether it’s increasing revenue, capturing market share, or improving brand reputation.
How to calculate product performance?
Calculating product performance depends on your specific goals, but common metrics include:
- Sales Volume – How many units were sold during a specific period
- Revenue Contribution – The percentage of total sales the product represents
- Profit Margin – Profit earned per unit or as a percentage of revenue
- Return Rate – The number of returned items, which may reflect quality or satisfaction issues
- Customer Ratings & Reviews – Average scores and feedback on platforms like Amazon or your ecommerce site
A basic formula could look like:
Product Performance Score = (Revenue × Profit Margin) – (Returns × Cost) + (Customer Satisfaction Score × Weight)
You can customize the formula based on what matters most—financial impact, user feedback, or operational efficiency.
How do you describe the performance of a product?
To describe product performance, focus on a mix of quantitative and qualitative insights. For example:
“The product is performing well in the mid-tier market segment, with strong month-over-month sales growth, a 4.6-star average customer rating, and a return rate under 2%. It consistently meets quality expectations and has received positive feedback for ease of use and design.”
You might also highlight performance against KPIs like speed, lifespan, accuracy, or customer adoption, depending on the product type (e.g., tech, apparel, software, etc.).
How would you evaluate the performance of a product?
Evaluating product performance involves reviewing a combination of financial, operational, and customer-focused indicators. Key steps include:
- Analyze sales trends – Look at revenue, units sold, and seasonal demand.
- Review customer feedback – Collect reviews, survey results, and net promoter scores (NPS).
- Check return and defect rates – High return or warranty claims may signal performance issues.
- Monitor product usage – For software or digital products, analyze usage rates and engagement.
- Compare to competitors – See how your product stacks up in terms of price, features, and satisfaction.
- Evaluate lifecycle metrics – Track performance from launch to maturity and any declines.
Using a combination of these factors offers a complete picture and helps guide improvements or future investments.