In the last decade or so, the Indian beauty market has undergone a drastic seismic shift. Beauty companies did exist, but the actual customer pool was small and the range of products minimal. Now, every brand selling in the Indian market has stepped up its game by curating a product range per international market and continuously making improvements with detailed makeup product insights.
One of our clients, let’s call them Sweet Makeup, came to us with a challenge of capturing more market share in a competitive industry and saw good results with our platform, 42Signals. Let’s look at how they achieved such a feat.

Image Source: Fortune Business Insights
Why Beauty Brands Need Real-Time Makeup Product Insights
Sweet Makeup has been in the beauty industry since 2017, and amidst tough competition, they’ve made their mark by building bold, long-lasting cosmetics designed for Indian skin tones. Yet, scaling across the country required some effort, and the rapidly evolving e-commerce ecosystem was daunting.
Here are the challenges they faced –
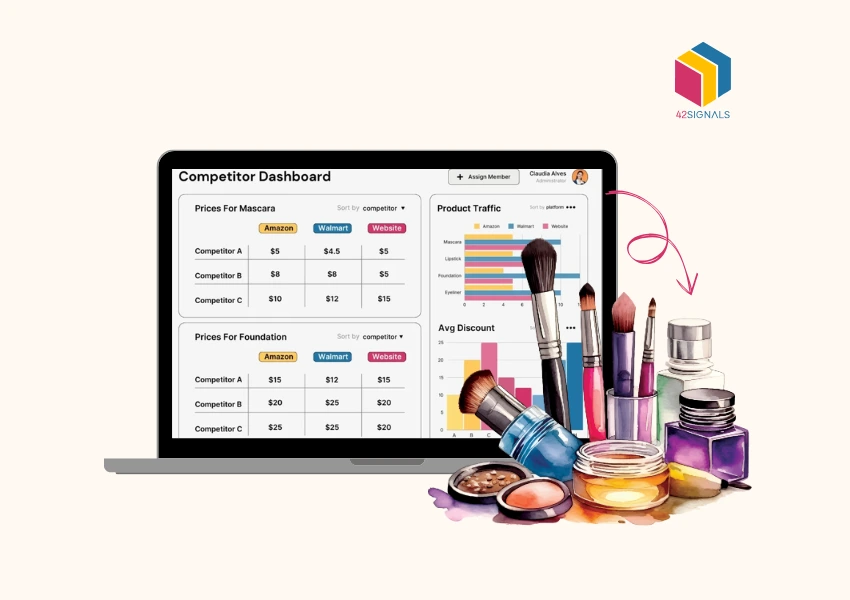
- Platform Proliferation: Selling across 9 major ecommerce and quick commerce platforms like Amazon, Nykaa, Flipkart, Blinkit, requires prompt and timely data and expertise. Each platform’s unique algorithms, promotional structures, seller details, and price fluctuations made pricing and selling items a difficult problem.
- Price Issues: Different sales models for each platform and several different resellers meant a constant risk of price violations. This, in a nutshell, kept breaching the brand’s carefully set guardrails. MAP violations aren’t good for brands as they trigger cascading financial penalties and erode trust.
- Visibility Problems: Ensuring all products were not just listed but also visible in the right place with prominent banners and high search ranking, so consumers in the same space can see products more frequently.
- Product Availability: Could a customer in Bhopal or Bhubaneswar actually get their favourite Sweet Makeup lipstick delivered today? Pin-code level availability was inconsistent and hard to track manually.

- Device Compatibility: Finding out that 85% of their users were using Android phones presented a better targeting opportunity but also a potential blind spot if strategies weren’t mobile-app focused.
- Competitor Blind Spots: Knowing the competitor landscape was a huge hurdle as well because it’s not only a matter of who you are selling to, but who others are selling to as well. Prices, promotions, and perception of other brands in the same space are equally important for Sweet Makeup.
Relying on scattered reports, platform seller dashboards, and manual checks was inefficient and error-prone. Sweet Makeup needed a single source of truth – a central nervous system for their digital shelf; ecommerce analytics for beauty brands.
Digital Shelf Analytics: The Four Pillars of Detailed Makeup Product Insights
Detailed makeup product insights require the creation of a strategic dashboard that consolidates real-time data feeds from all ecommerce and quick commerce platforms like Blinkit, Instamart, so it can be transformed into actionable insights through four core modules.
1. Pin-code Perfect Availability Tracking
The Problem: A customer seeing a product online only to find it unavailable at checkout is a conversion killer and brand detractor. Manually checking stock across thousands of pin codes and SKUs on 9 platforms was impossible.
The InsightEdge Module: Ecommerce analytics for beauty brands provided real-time, SKU-level visibility into stock availability down to the pin-code level across all partner platforms. Maps and heatmaps visually highlighted high-demand areas with low stock, enabling proactive replenishment alerts to logistics partners and platforms. It also flagged “discontinued products” still showing as active on certain platforms, preventing customer frustration.
The Impact: Dramatically reduced “out-of-stock” instances during campaigns, improved delivery promise accuracy, and enhanced customer satisfaction. Sales teams could confidently push promotions in regions where stock was confirmed.
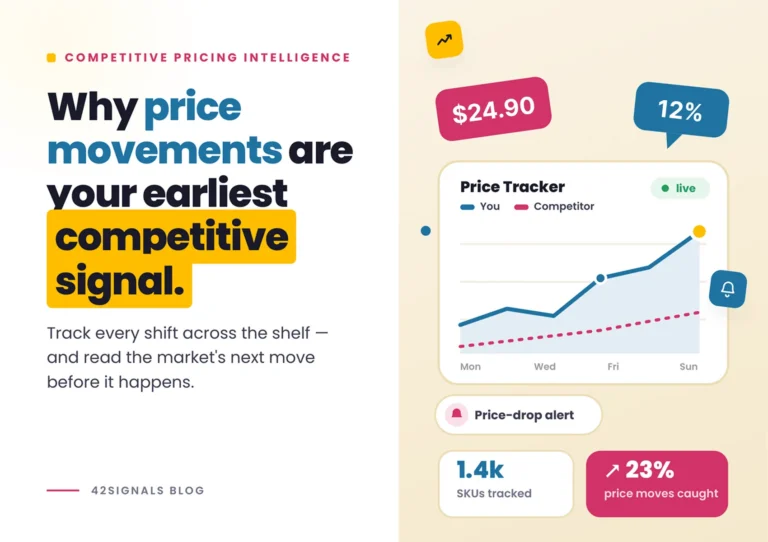
2. Guardrail Sentinel: Real-Time Price Violation Detection
The Problem: With complex, varying agreements per platform (“different sales models”), inadvertent or malicious price violations were a constant threat. These breaches invalidate partner incentives, damage relationships with key retailers, and can easily undermine premium brand positioning. Manual price monitoring across hundreds of SKUs and platforms can feel akin to finding a needle in a haystack.
The InsightEdge Module: This was the heartbeat of the operation. It continuously monitored the selling price (including promotions, coupons, and bundled offers) of every Sweet Makeup’s SKU and sub-brand across all platforms, comparing it against the pre-defined, non-negotiable ‘guardrail’ prices. Any breach triggers instant, high-priority alerts to the sales ops and channel management teams via mobile notifications and the competitor analysis dashboard.
The Impact: Near-instantaneous detection allowed for rapid rectification, often within hours, minimizing financial penalties and preserving crucial channel relationships. Sales teams could breathe easier, knowing incentives were protected. This module embodied critical product price analytics and retail pricing analytics, ensuring pricing integrity was maintained at all times.
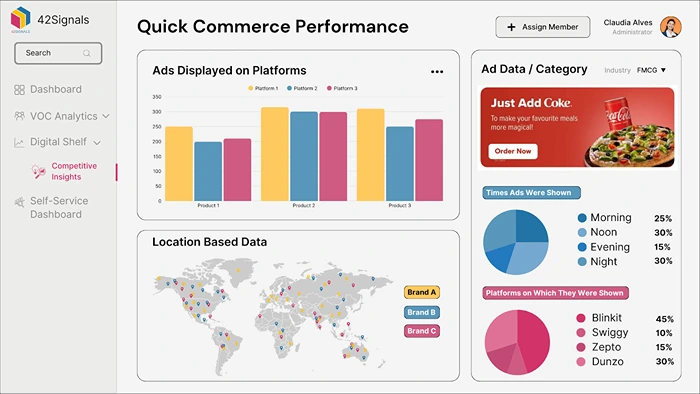
3. Ad Spend ROI: Tracking Banner Visibility for Beauty Brands
The Problem: Securing prime banner advertising space on platform homepages or category pages was expensive and competitive. But how could Sweet Makeup be sure their campaigns were actually running as booked, appearing to the right users, at the right time? The answer lay in looking at the cosmetic pricing strategy in India.
The InsightEdge Module: This tool used automated screenshot capture and image recognition (or direct platform API feeds where available) to track the actual display of Sweet Makeup’s paid banners across the 9 apps. It logged the time, duration, position, and crucially, whether the banner was visible within the user’s viewport (not just loaded off-screen). It could correlate this with campaign periods and target demographics.
Leveraging Android: Knowing their user base was overwhelmingly Android, Sweet Makeup could instruct platform ad managers to heavily weight their banner campaigns towards Android users within the platforms’ targeting options, maximizing efficient spend.
The Impact: Provided irrefutable proof of performance for media spending, allowed for optimization of ad placements, and ensured marketing budgets were delivering actual visibility. It moved beyond vanity metrics to prove real digital shelf presence.
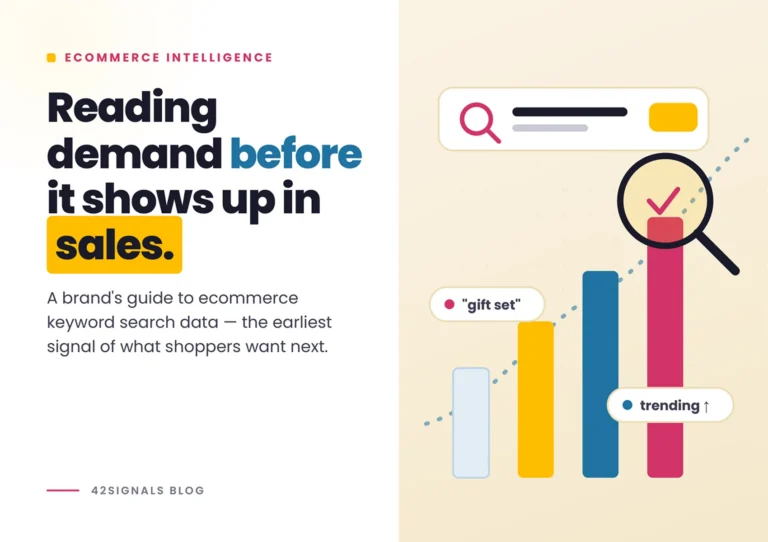
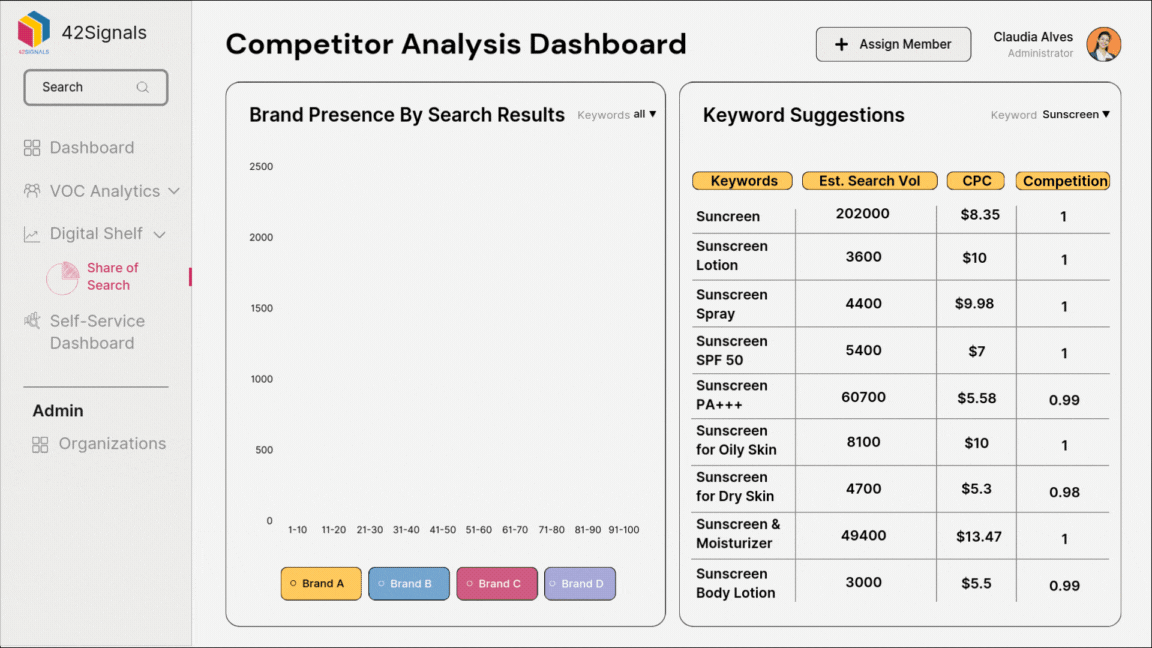
4. Share of Search (SOS) Compass: Tracking Mindshare
The Problem: When a customer searches for “matte lipstick” or “kajal” on Nykaa or Amazon, did Sweet Makeup appear? How high? Who appeared above them? Organic search ranking is a powerful indicator of brand health and discoverability.
The InsightEdge Module: Share of search insights continuously tracked Sweet Makeup’s ranking for hundreds of critical keywords (branded, generic, and competitor-related) across the search functions within all 9 partner apps. It calculated their ‘share of search’ – the percentage of top-ranking positions they owned for key terms compared to competitors. The competitor analysis dashboard visualized this, showing who was gaining or losing SOS ground.
The Impact: Provided an early warning system for declining visibility. Informed SEO strategy within platform constraints (e.g., optimizing product titles, descriptions, images). Highlighted competitor keyword strategies. SOS became a leading indicator of sales trends and brand salience.
Beyond the Modules: The Power of Integrated Intelligence
Project Insight’s power wasn’t just in these four modules, but in their integration and the additional self-service capabilities it provided:
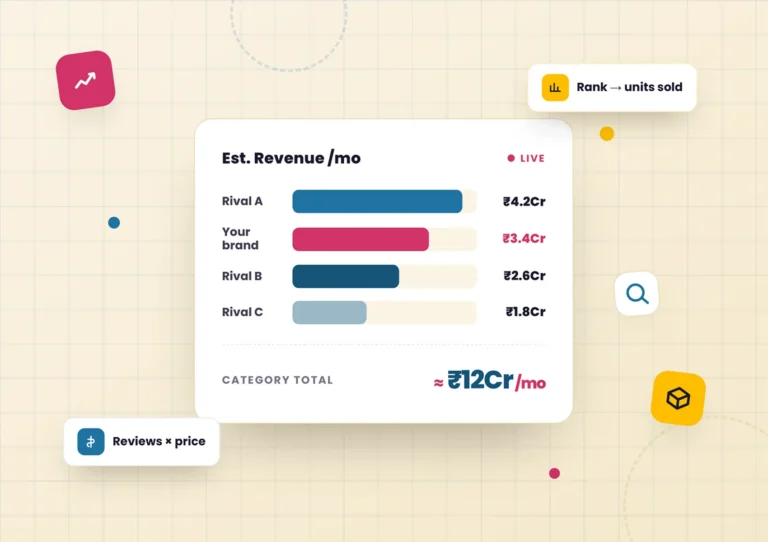
Competitor Analysis Dashboard: This wasn’t a separate tool, but a lens applied across all modules. Sweet Makeup could track competitors’ prices (fueling their own retail pricing analytics), stock availability, banner placements, and SOS rankings alongside their own data on a single screen. Understanding the competitor landscape became proactive, not reactive. It also helped with learning about the cosmetic pricing strategy in India.
Customer Review & Product Aspect Mining: Sentiment analysis parsed thousands of customer reviews from the platforms, surfacing key themes (“long-lasting,” “smudge-proof,” “shade range,” “packaging issues”). This provided direct R&D and marketing feedback loops.
Centralized Self-Service: Teams (Marketing, Sales, E-commerce Ops, Supply Chain) could access tailored dashboards without relying on data scientists. Need to check a specific sub-brand’s price compliance on Flipkart? Or SOS for serums in Mumbai? It was a few clicks away.
The Positives: From Detailed Makeup Product Insights to 20% Market Share
The implementation of deep, detailed makeup product insights revolutionized how Sweet Makeup conducted operations –
- Guardrail Guarantee: Eliminating price violations protected millions in margin and solidified trust with key channel partners. Sales teams could confidently execute promotions knowing the guardrails were policed in real-time.
- Optimized Ad Spend & Visibility: Banner tracking ensured marketing rupees delivered actual impressions. Android-focused targeting maximized ROI. High SOS ensured discoverability.
- Supply Chain Synchronization: Pin-code availability data provided by 42Signals on major platforms reduced stockouts by 30% in key locations, directly boosting sales and customer satisfaction.
- Proactive, Not Reactive Reactions: Instead of looking at issues and firefighting them as they come up – stockouts, price breaches, disappearing banners – teams can anticipate and prevent them with the right detailed makeup product insights.
- Decisions Made with Data: With 42Signals, new product launches were informed by the right review mining, and targeted promotions were based on regional availability and competitor pricing. These data insights, fueled by product price analytics, inform discounting strategies without eroding brand value.
- Resource Efficiency: The dashboards helped with digital shelf optimization and replaced hundreds of hours of manual monitoring with automated price alerts that freed teams for important strategic tasks.
Lessons for the Beauty Battleground
Sweet Makeup cosmetics’ success offers crucial share of search insights and ecommerce data for any brand navigating the digital shelf –
- The Digital Shelf is the Primary Shelf: For beauty, especially with the rise of Q-commerce, online presence isn’t optional; it’s paramount. Mastering digital shelf optimization requires dedicated tools.
- Price Integrity is Non-Negotiable: Retail pricing analytics and product price analytics are critical for protecting margins and channel relationships. Automated guardrail monitoring is essential in complex multi-platform environments.
- Visibility leads to Discoverability, which leads to Sales: Tracking banner visibility and share of search provides tangible metrics for marketing effectiveness beyond clicks and spend. Organic visibility is a key health indicator.
- Product Availability Cannot be Messed With: Pincode-level stock tracking and inventory management help bridge gaps between online interest and a fulfilled order.
- Don’t Forget Your Competitors: Having a robust competitor analysis dashboard helps in several ways, with real-time digital shelf data that’s crucial for strategic agility.
Try 42Signals today for your analytics and data needs. Don’t be left behind your competitors, already using ecommerce analytics to improve their business.
Frequently Asked Questions
How to get product insights?
To gather product insights, you’ll want to observe how customers interact with your product and listen to what they say about it. Some of the most effective methods include:
- Customer interviews or surveys – Ask users directly what they like, dislike, or wish were different.
- Product analytics – Use tools like 42Signals or Google Analytics to track how people use your product.
- User reviews & feedback forms – Public feedback often reveals recurring issues or opportunities.
- Support tickets & complaints – These often highlight pain points worth solving.
- Competitor analysis – See what similar products do differently and how their customers respond.
Combining qualitative and quantitative data gives you a well-rounded view of what users need — and how your product is (or isn’t) meeting those needs.
What is an example of a product insight?
A product insight is a clear observation about customer behavior or needs that can guide product decisions. Here’s a real-world example.
After reviewing customer support logs, a software company noticed that many new users struggled with onboarding. The insight: “Users drop off during setup because the process is too complex.”
This led them to redesign their onboarding experience, resulting in higher activation rates.
In short, an insight is more than just data — it’s a meaningful takeaway that helps improve your product or strategy.
How do I get my product noticed?
Getting a product noticed requires a mix of smart marketing, strong messaging, and being present where your audience spends time. Here are some ways to start:
- Use content marketing (blog posts, videos, or social media) to educate or solve a problem your product addresses.
- Run targeted ads on platforms like Google, Instagram, or LinkedIn to reach specific buyer personas.
- Leverage influencers or brand advocates to talk about your product.
- Offer free trials or demos to reduce the risk for new users.
- Get listed on product directories like Product Hunt, G2, or AppSumo (if relevant).
Above all, make sure your value proposition is clear: why should someone care about your product over others?
How do I start my insights?
Starting your insight process begins with asking the right questions and collecting the right signals. Here’s how to kick it off:
- Define your objective – Are you trying to improve a feature, understand user behavior, or test a new idea?
- Pick your methods – Choose from interviews, surveys, analytics, A/B testing, or user observation.
- Start small – Talk to a few real users, analyze early trends, and validate assumptions.
- Look for patterns – Insights come from repeated behaviors or feedback that point to an underlying need or friction point.
- Document your findings – Keep a log of observations, quotes, and analytics in a shared space for your team.
Good insights usually come from curiosity and consistent listening, not just big data.