Mastering Your Ecommerce Reporting Tools for Growth
Most ecommerce teams are tracking the wrong things. Traffic, total revenue, and site-wide conversion rate are metrics — they tell you what happened. A real KPI framework tells you why, and what to do next. This guide covers how to build a three-layer reporting stack that connects raw data to strategic decisions, why ecommerce OKRs outperform traditional KPI tracking for cross-functional alignment, and how a category scorecard gives merchandising teams the granular visibility that executive dashboards miss entirely.
Why Your Current Ecommerce Reporting Tools Are Falling Short
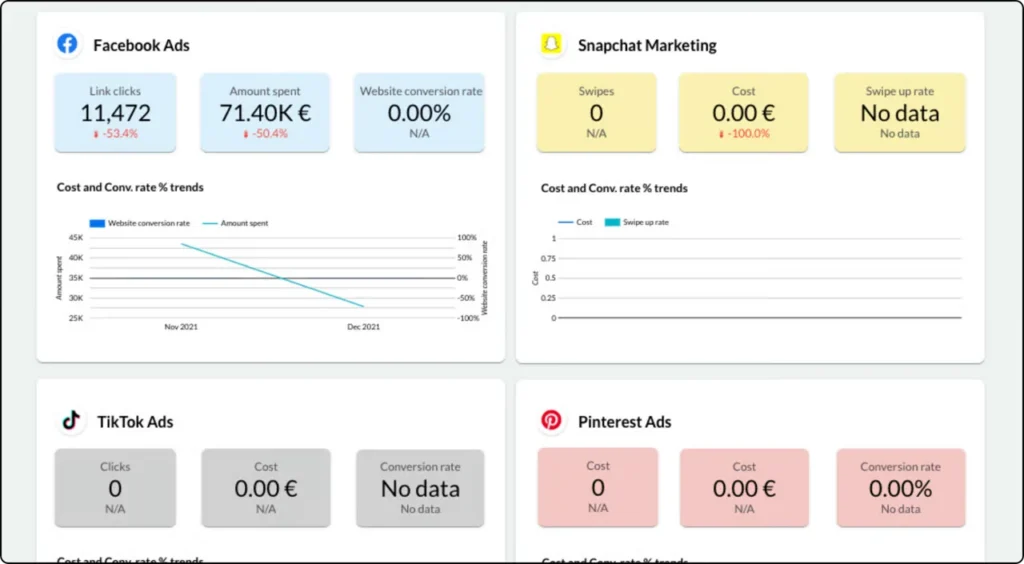
Image Source: Supermetrics
If you’re running an online business, you know the drill: daily sales reports, weekly inventory checks, and monthly deep dives into marketing spend. But as the competition heats up and customer behavior constantly evolves, relying on a patchwork of basic spreadsheets and disparate platform dashboards simply isn’t enough. Many modern ecommerce teams are drowning in data yet starved of genuine insight. The tools they use often tell what happened, but rarely why or what to do next.
In 2026, the successful ecommerce operator needs more than just data aggregation; they need a strategic reporting infrastructure—a robust ecommerce reporting tools stack—that connects sales performance directly to strategic goals. This article will serve as your comprehensive blueprint for building that infrastructure, focusing on not just the technology, but the crucial frameworks needed to interpret the data effectively.
The Three-Layer Ecommerce Reporting Stack
A modern ecommerce reporting tools stack is more than just Google Analytics and your Shopify dashboard. It’s an integrated system designed for scalability, deep analysis, and cross-functional visibility.
The Core Components of a Powerful Reporting Stack
To move from basic tracking to strategic performance management, your stack needs three critical layers:
- Data Collection and Integration Layer: This is where all your raw data lives. It must pull information seamlessly from every corner of your business—your CRM, ERP, logistics provider, marketing platforms (like Meta and Google Ads), and, of course, your ecommerce platform. Having fragmented data sources is one of the biggest hurdles to effective reporting.
- Data Warehousing and Transformation Layer: Raw data is often messy and inconsistent. This layer cleans, standardizes, and organizes the data, often in a cloud data warehouse (like Snowflake or Google BigQuery), making it ready for analysis. This step is non-negotiable for anyone looking to build a scalable KPI framework ecommerce.
- Visualization and Analysis Layer: This is the interface where your team interacts with the data, turning complex datasets into easy-to-understand charts, graphs, and dashboards. Tools like Tableau, Power BI, or even specialized ecommerce reporting tools are key here. This is the front end of your retail kpi dashboard.
Metrics vs. KPIs: Why Most Ecommerce Teams Track the Wrong Things
The biggest mistake businesses make when using ecommerce reporting tools is tracking too many vanity metrics. A metric is just a number; a Key Performance Indicator (KPI) is a metric tied directly to a strategic outcome. The right KPI framework ecommerce moves you from passive reporting to proactive strategic execution.
Beyond Basic Metrics: Defining Meaningful KPIs
While metrics like Website Traffic and Total Revenue are essential, truly meaningful KPIs often involve ratios and comparisons that reveal efficiency and profitability.
- Customer Acquisition Cost (CAC) vs. Customer Lifetime Value (CLV): This ratio is arguably the most important profitability KPI. A healthy CLV:CAC ratio (often recommended at 3:1 or higher) indicates sustainable growth. Learn more about consumer behavior trends in ecommerce.
- Conversion Rate by Channel: Simply tracking a site-wide conversion rate is unhelpful. Breaking it down by marketing channel (e.g., paid search, social media, organic) tells you where your marketing dollars are most effective.
- Average Order Value (AOV) and Item Per Order (IPO): These metrics are direct indicators of merchandising success and customer engagement with product recommendations or bundling strategies.
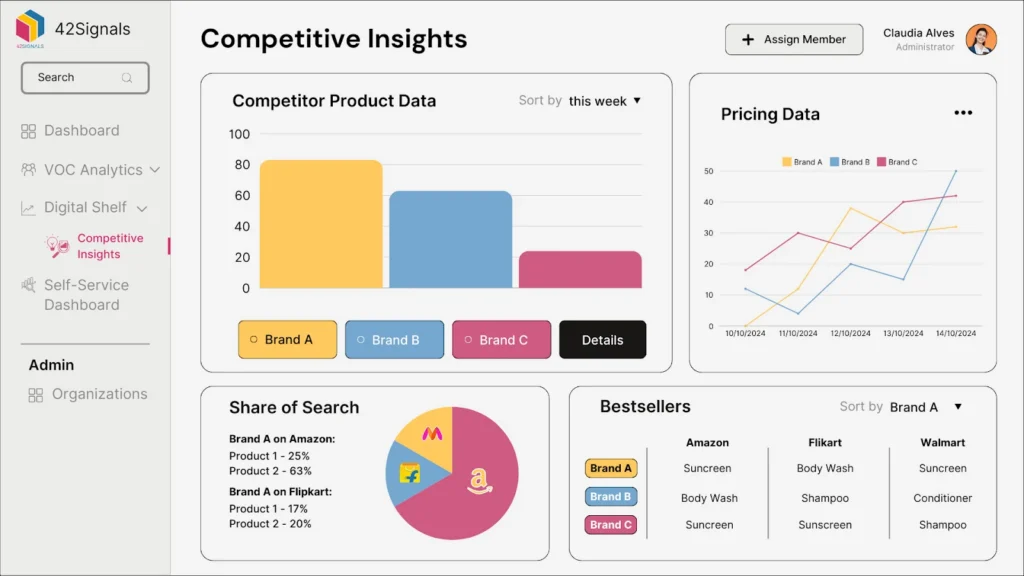
How to Structure a Retail KPI Dashboard by Team and Decision Type
A well-designed retail KPI dashboard acts as the central nerve center for your business. It shouldn’t just display data; it should facilitate decision-making. The dashboard should be tiered: a high-level executive view focusing on revenue and profitability, and deeper operational views for marketing, logistics, and merchandising teams.
Implementing Advanced Frameworks: Ecommerce OKRs and Scorecards
For companies aiming for aggressive growth, the traditional KPI approach often lacks the strategic depth required to align large teams. This is where Objectives and Key Results (OKRs) and category scorecards via price benchmarking analytics become essential tools in your ecommerce reporting tools repertoire.
Ecommerce OKRs: Aligning Performance with Purpose
OKRs provide a strategic framework where a challenging Objective (what you want to achieve) is supported by measurable Key Results (how you know you achieved it). They ensure every team member understands their contribution to the overarching company goals.
For example, a high-level Objective might be: “Dominate the sustainable apparel market segment in Q3.” The supporting Key Results could be:
- KR 1: Increase organic traffic to sustainability-focused product pages by 40%.
- KR 2: Achieve a 15% conversion rate on the new ‘Eco-Friendly Line’ collection.
- KR 3: Increase customer satisfaction (CSAT) score for post-purchase communication by 8%.
Implementing ecommerce OKRs requires ecommerce metrics tracking that can aggregate performance data across various functions (marketing, product, customer service) into a single view that shows progress against the KR targets. This requires advanced configuration of your ecommerce reporting tools.
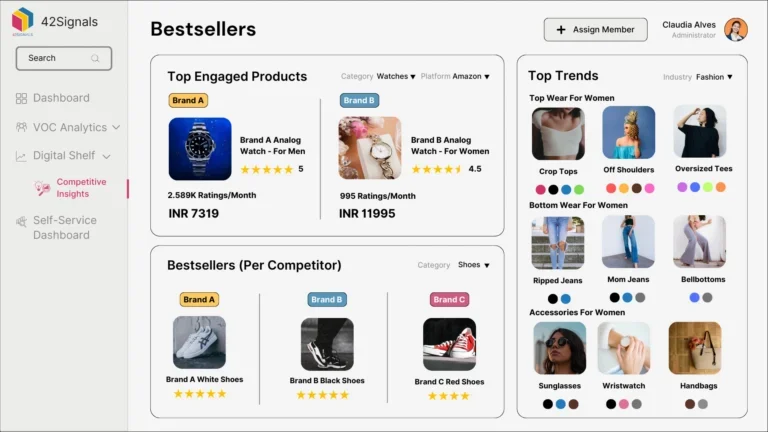
The Category Scorecard: A Merchandising Reporting Framework
Merchandising is often a black box in traditional reporting. A category scorecard brings clarity by assessing the health and performance of individual product categories, not just the entire business.
A scorecard should include both financial and operational health metrics:
- Financial Metrics: Gross Margin, Sell-Through Rate, Inventory Turn.
- Operational Metrics: Stock-Out Rate, Returns Rate (by category), Time to Market for new products.
By implementing a category scorecard, you can instantly identify categories that are high-performing but low-margin, or those that are dragging down overall inventory efficiency. This level of granularity in retail performance reporting is critical for profit optimization.
Technical Deep Dive: The Role of Integration in Ecommerce Metrics Tracking
The success of your chosen KPI framework ecommerce hinges on the accuracy and accessibility of your data. This is where the technical layer of your ecommerce reporting tools stack comes into play.
The Importance of Data Normalization
Different platforms often report the same metric differently. For example, Google Analytics might report a session differently than your internal platform reports a visit. This is why data normalization is vital. It involves defining consistent standards for key terms (e.g., “customer,” “order value,” “return”) across all data sources before they hit your visualization dashboard. Without this step, your ecommerce metrics tracking will be inconsistent, leading to flawed decisions.
Moving Beyond Spreadsheets: Data Warehouse Fundamentals
While it’s tempting to manage data in Excel, a cloud data warehouse (CDW) is necessary for any high-growth ecommerce business. A CDW offers:
- Scalability: Handling massive volumes of data without slowing down.
- Historical Analysis: Retaining years of granular data for deep trend analysis.
- Single Source of Truth: Ensuring that all teams are pulling data from the exact same, verified source, eliminating debates over data accuracy.
Choosing the right connectors and ETL (Extract, Transform, Load) processes is the crucial step in ensuring your raw data is consistently feeding your retail kpi dashboard.
Overcoming Common Challenges in Retail Performance Reporting
Even with the best ecommerce reporting tools in place, teams often struggle with adoption and accuracy.
Challenge 1: Data Silos and Cross-Functional Reporting
Marketing, operations, and finance teams often view performance through different lenses, leading to data silos. Marketing might focus on ROAS (Return on Ad Spend), while finance focuses on Gross Margin.
Solution: The ecommerce OKRs framework helps break these silos. By creating KRs that require collaboration (e.g., Reduce total cost per fulfilled order by 10%), you necessitate shared data visibility and shared responsibility, unifying your ecommerce reporting tools output.
Challenge 2: Reporting Lag and Decision Timeliness
If it takes three days to compile the data needed to make a pricing decision, the opportunity may have already passed. Effective ecommerce metrics tracking must be near real-time.
Solution: Invest in an automated data pipeline. Modern ecommerce reporting tools and visualization platforms are designed to connect directly to the data warehouse, automatically refreshing dashboards multiple times per day. The goal should be to reduce human intervention in the reporting process to zero.
The Future of Ecommerce Reporting Tools: AI and Predictive Analytics
The landscape of retail performance reporting is rapidly changing. The next generation of ecommerce reporting tools will focus less on what happened and more on what will happen.
Leveraging AI for Predictive Insights
Artificial intelligence and machine learning are being integrated into advanced reporting stacks to provide:
- Demand Forecasting: Predicting future inventory with ecommerce market intelligence needs based on seasonality, promotions, and external factors, significantly improving your category scorecard metrics related to stock levels.
- Customer Churn Prediction: Identifying high-risk customers based on their behavior, allowing for targeted retention campaigns.
- Anomaly Detection: Automatically flagging unusual spikes or drops in key metrics that might otherwise be missed in a complex retail kpi dashboard.
These predictive capabilities turn your ecommerce reporting tools from historical trackers into powerful strategic accelerators.
The 42Signals Advantage: Building Your Optimal Stack
At 42Signals, we understand that the right ecommerce reporting tools stack is unique to every business, but the underlying principles of data integrity and strategic alignment remain constant.

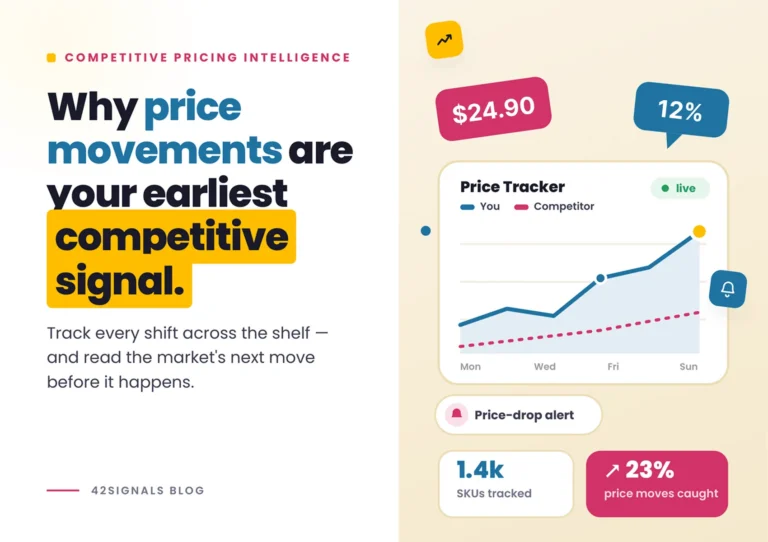
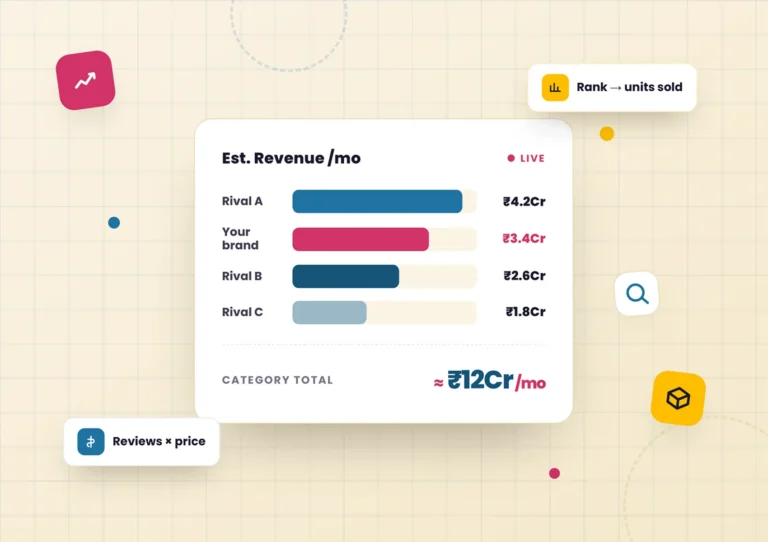
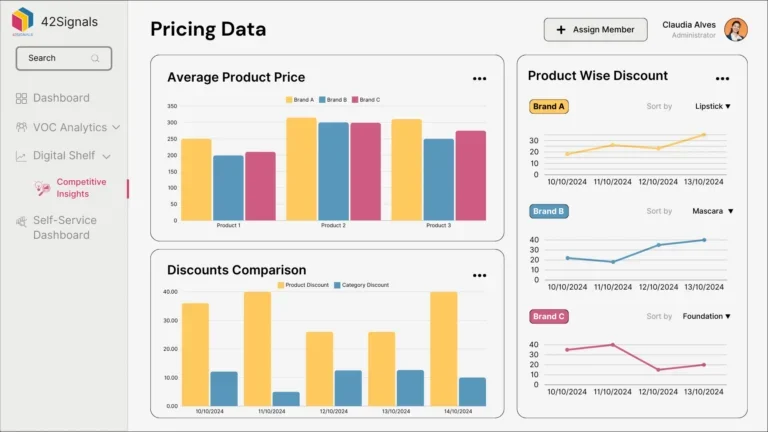
Where most reporting stacks stop at internal data — your own sales, sessions, and ad spend — 42Signals adds the external competitive layer: what your competitors are charging, how your digital shelf performance metrics is trending, and what customers are saying about your category. These inputs feed directly into the category scorecard and OKR frameworks described above, closing the gap between internal performance tracking and market-level decision making.
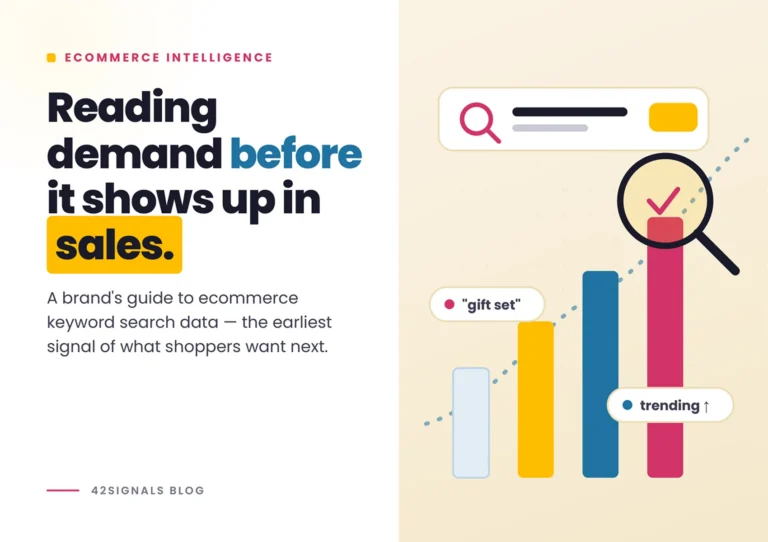
The KPI framework only works when your data includes the competitive layer — what the market is doing, not just what your store is doing. 42Signals adds real-time ecommerce competitor price intelligence with digital shelf analytics, and category share of search analytics to your reporting stack. Book a demo and we’ll map 42Signals’ data outputs to your existing KPI framework in the first session.
Frequently Asked Questions (FAQs) About Ecommerce Reporting Tools
What is the single most important KPI for a new ecommerce business?
The single most important KPI for a new ecommerce business is often the Customer Acquisition Cost (CAC) and its relationship to the Customer Lifetime Value (CLV). While total revenue is exciting, understanding how much you can afford to spend to acquire a customer, and ensuring that customer pays you back over time, determines long-term viability. Focus your initial ecommerce metrics tracking here to ensure your growth is sustainable.
How often should I review my retail KPI dashboard?
Executive and high-level strategy dashboards (focused on revenue and profitability) should be reviewed daily or weekly, depending on your transaction volume. Operational dashboards (like those tracking marketing spend efficiency, inventory levels, or customer service response times) should be reviewed daily by the relevant department heads. Strategic frameworks like ecommerce OKRs should be reviewed weekly for progress checks and monthly for deep dives. The frequency of using your ecommerce reporting tools must match the pace of your business decisions.
Should I use open-source or proprietary ecommerce reporting tools?
The choice between open-source and proprietary tools depends on your budget, internal technical expertise, and scale. Proprietary, specialized platforms often offer user-friendly interfaces and faster implementation, making them ideal for businesses lacking dedicated data engineering teams. Open-source solutions offer maximum customization and cost savings but require significant internal resources for setup, maintenance, and integration. For building a complex KPI framework ecommerce solution, a combination of both is often the optimal path, using proprietary tools for visualization and open-source solutions for certain custom data transformations.
What is the main difference between a metric and a KPI in retail performance reporting?
A metric is any quantitative measurement (e.g., website clicks, number of returns). A KPI (Key Performance Indicator) is a metric that is strategically tied to a business goal. For example, “Total Clicks” is a metric. “Clicks from Paid Search (Channel) resulting in a 5% Conversion Rate (Goal)” is a KPI. KPIs inform critical business decisions and are the focus of a healthy KPI framework ecommerce.
What external data sources should be included in an ecommerce reporting stack?
Most stacks focus entirely on internal data — sessions, orders, ad spend. The gap is external competitive data: competitor pricing, digital shelf share, and category-level consumer sentiment. Without these signals, your KPIs tell you how you’re performing internally, but not whether you’re gaining or losing ground in the market.