How to Prove What Your Analytics Is Actually Worth with ECommerce ROI
Every analytics team faces the same budget conversation: leadership wants to know what the data investment is actually worth. The answer requires more than dashboards — it requires a framework that connects a specific insight to a specific action to a specific dollar amount. This guide covers a four-phase process for doing exactly that: defining measurable hypotheses before acting, isolating outcomes through controlled experiments, calculating incremental revenue against the true cost of the insight, and reporting the result in a format that makes the analytics business case irrefutable. The same framework applies whether you’re proving the ROI of a price optimisation insight, a checkout flow change, or a category management decision.
Proving the Value: Why Measuring Ecommerce ROI is Non-Negotiable
Every business invests in tools, people, and processes with the expectation of a return. In the world of commerce, whether you’re a large retailer or a fast-growing direct-to-consumer brand, the investment in gathering, analyzing, and acting on data insights is substantial. From sophisticated retail intelligence platforms to dedicated data science teams, the expense adds up quickly. Therefore, understanding and quantifying the ecommerce roi of these investments is crucial for long-term success and strategic alignment. Without a clear framework for proving this value, analytics initiatives can easily be the first on the chopping block during budget reviews.
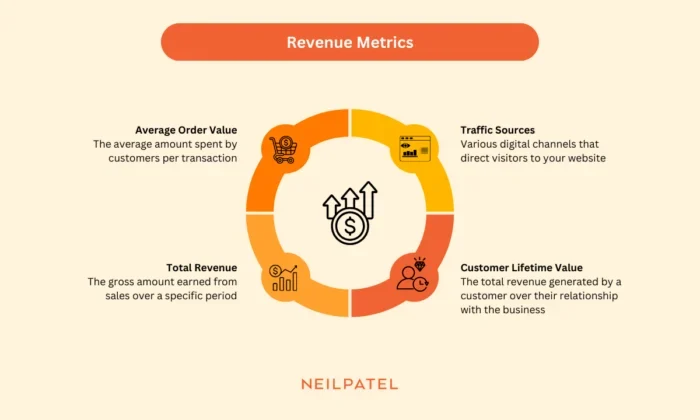
Image Source: Neil Patel
This goes beyond just tracking basic sales metrics. We’re talking about isolating the financial benefit directly attributable to an insight derived from your commerce analytics. For instance, if an insight leads to optimizing your product recommendations, we need a way to quantify the incremental revenue analytics generated solely by that change. This level of precision is what validates the entire analytics ecosystem.
The Challenge of Quantifying Retail Analytics Impact
One of the biggest hurdles in calculating the return on investment for analytics is the complexity of modern commerce. Data flows from countless sources—website traffic, inventory systems, marketing campaigns, customer service logs, and more. Pinpointing the exact cause-and-effect relationship between an insight and a financial outcome can feel like finding a needle in a digital haystack.
For example, a new merchandising strategy, informed by category management ROI analysis, might involve changes to product placement, price, and promotions all at once. If sales increase, how much of that uplift came from the price change, and how much from the better placement suggested by the data? This is where a defined measurement framework becomes essential. It provides the rigor necessary to isolate variables and attribute financial results accurately, thereby clearly demonstrating the retail analytics impact.
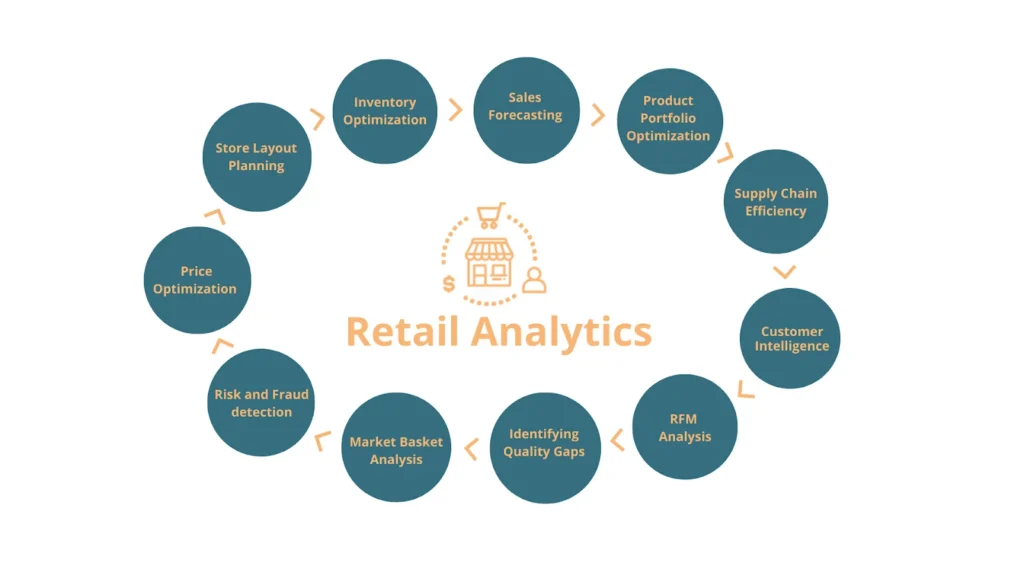
Image Source: Virtue Analytics
Shifting the Mindset: From Cost Center to Profit Driver
Historically, analytics departments have sometimes been viewed as a necessary overhead, a cost center that supports the business but doesn’t directly generate revenue. Implementing a formal ROI measurement framework is the key to changing this perception. When you can consistently report, “This insight, derived from our platform, led to a $X increase in profit this quarter,” the conversation immediately shifts. Your analytics team transforms into a strategic profit driver, and the ecommerce roi becomes an easy argument to make. This shift not only secures future funding but also elevates the role of data across the entire organization.
Building Your Analytics Business Case: A Four-Phase Framework
To effectively measure the ROI of Commerce Insights, we propose a four-phase framework. This structure ensures that every step, from generating an insight to measuring its ultimate financial payoff, is documented, repeatable, and quantifiable. This framework serves as the backbone of your analytics business case.
Phase 1: Defining Measurable Success (The Insight-to-Action Link)
Before any analysis begins, success must be clearly defined and linked to a specific business metric. An insight is only valuable if it leads to a concrete action that impacts a key performance indicator (KPI).
Establishing the Hypothesis and Metric
Every analytics project should start with a hypothesis. Instead of a vague goal like “improve sales,” a better hypothesis is, “Optimizing the mobile checkout flow based on observed drop-off points will reduce cart abandonment by 10%, leading to a measurable increase in conversion rate.”
- The Insight: Analytics reveals that 40% of mobile users abandon their cart between the shipping and payment pages.
- The Action: The development team simplifies the payment page to require fewer clicks and fields.
- The KPI (Success Metric): Cart Abandonment Rate and Mobile Conversion Rate which can be found by certain digital shelf performance metrics.
This structured approach ensures that the resulting action is tied to a measurable change. By isolating the impact of this specific action, we are already laying the groundwork for incremental revenue analytics and calculating the true ecommerce roi.
Linking Data Value to Business Objectives
It’s vital that the data we prioritize aligns with high-level corporate objectives. If the company’s primary goal is customer retention, then the most valuable insights will be those that reduce churn or increase Customer Lifetime Value (CLV). If the goal is market penetration, insights into new customer acquisition channels or regional demand will have the highest commerce data value. This ensures that the investment in retail intelligence payback is focused on the most critical areas of the business. Learning consumer behavior trends is also helpful to understand customer preferences.
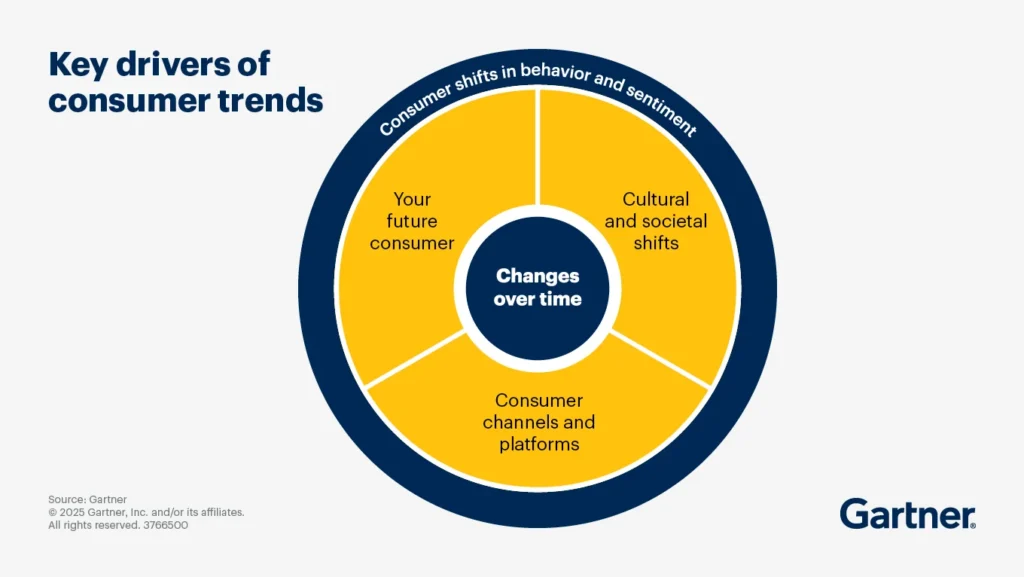
Image Source: Gartner
Phase 2: Action and Experimentation (Isolation for Accurate Measurement)
Once an insight and a corresponding action are identified, the next step is implementation. However, to accurately attribute the financial result, the action must be isolated, typically through structured experimentation like A/B testing (with ecommerce performance analytics) or a pilot program.
Running Controlled Experiments
The gold standard for proving causality is a controlled experiment. For the mobile checkout optimization example, an A/B test is essential. Group A (the control group) sees the old checkout page, while Group B (the test group) sees the new, simplified page.
- Isolation: The difference in performance between the two groups over the test period can be attributed only to the change in the payment page design. This eliminates the noise from other factors like concurrent marketing campaigns or seasonal demand shifts.
- Duration: The experiment must run long enough to achieve statistical significance, ensuring the observed results are not due to random chance.
This rigorous method provides the clean data needed to accurately calculate the analytics business case for the investment. Without this isolation, any ROI calculation is merely an educated guess.
The Role of Incremental Revenue Analytics
Incremental revenue analytics is the practice of quantifying the revenue generated above and beyond what would have been achieved without the specific action taken. If the control group had a 2% conversion rate and the test group had a 2.2% conversion rate, the 0.2 percentage point difference represents the incremental revenue generated by the optimized checkout page. This figure forms the core of your ecommerce roi calculation. It’s the clearest way to demonstrate the direct financial impact of an insight.
Phase 3: Financial Quantification (Connecting Dollars to Data)
This is where the rubber meets the road. The goal is to translate the performance lift from Phase 2 into actual monetary value.
The Core ROI Formula for Commerce Insights
The basic formula for calculating the ROI of a specific insight-driven action is:
$$ROI = \frac{(Gain \ Attributable \ to \ Insight) – (Cost \ of \ Action \ and \ Analytics)}{(Cost \ of \ Action \ and \ Analytics)} \times 100$$
Let’s break down the components for a more comprehensive retail analytics impact calculation:
- Gain Attributable to Insight: This is your incremental revenue analytics (e.g., the additional sales generated by the 0.2% conversion lift). To get the net gain, you must factor in the cost of goods sold (COGS) for those additional units, focusing on the incremental profit, not just revenue.
- Cost of Action and Analytics: This includes the specific costs associated with implementing the insight—e.g., the labor hours for the developer to change the checkout page, a fraction of the cost of the analytics platform used to generate the insight, and the time spent by the analyst.
Accurately tallying these costs is critical for a credible analytics business case. For example, if a category management ROI project required 80 hours of analyst time at an average cost of $75 per hour, that $6,000 labor cost must be included in the denominator.
Measuring Category Management ROI
For retailers, insights related to product mix, pricing, and inventory management are typically bundled under category management. Measuring the ROI here is highly focused on efficiency and profit margin.
- Insight Example: Data shows that a specific product category has high demand but experiences frequent out-of-stocks, leading to lost sales.
- Action: The buyer increases the safety stock for this category by 20%.
- Measurement: The key metrics are the reduction in lost sales (measured by demand not fulfilled due to OOS) and the marginal increase in carrying costs (the cost of holding the extra 20% stock).
- The Payback: The category management ROI is calculated by netting the profit from the recovered sales against the marginal increase in inventory carrying costs. This clearly demonstrates the financial ecommerce roi (with price and availability ecommerce) of the analytics driving the inventory decision.
Phase 4: Reporting and Iteration (Scaling the Commerce Data Value)
The final phase involves documenting the results, communicating the ecommerce roi across the organization, and using the learnings to refine future analytics efforts. This is essential for achieving long-term retail intelligence payback.
Creating the ROI Report Card
The ROI report should be concise, clear, and focused on the financial outcome. It should include:
- The Problem: The business challenge identified.
- The Insight: The specific data point that drove the solution.
- The Action: The change implemented (e.g., A/B test description).
- The Result: The measured incremental revenue analytics (e.g., 0.2% conversion lift).
- The Financial ROI: The final calculated number, demonstrating the profit generated against the cost incurred.
Presenting these results regularly, perhaps as a quarterly “Analytics Value Review,” solidifies the perception of analytics, especially competitor price intelligence as a valuable investment. According to a 2024 study by Forrester, companies that formally attribute revenue to analytics initiatives are 2.5 times more likely to report higher growth rates than their competitors (Source: Forrester, The Total Economic Impact of Data and Analytics Platforms, 2024).
Iteration and Scaling
A successful experiment isn’t just about a one-time win; it’s a blueprint for future commerce data value. If optimizing the mobile checkout generated a positive ROI, the next step is to apply the same analytical lens to the desktop checkout, the cart page, or the product detail pages. This systematic scaling of successful insights maximizes the overall ecommerce roi from your existing data infrastructure. The learnings from the initial test should feed directly into the prioritization of the next set of analytics projects, continually building the retail intelligence payback cycle.
Technical Pillars for Accurate ROI Reporting of Commerce Insights
Achieving a reliable ROI measurement requires robust technical foundations. Without these pillars, attributing financial outcomes can become murky, undermining the credibility of your analytics business case.
Data Governance and Quality: The Foundation of Trust
Dirty or inconsistent data is the enemy of accurate ROI reporting. If your customer IDs are not universally consistent across your marketing, sales, and analytics systems, you cannot accurately track a customer’s journey and attribute a purchase to a specific insight. High-quality data governance ensures that the data used to generate the insight and the data used to measure the outcome are reliable and harmonized. This guarantees that your ecommerce roi calculations are based on facts, not flawed numbers.
Unified Customer View: Tracking the Full Journey
For true commerce data value measurement, you need a single, unified view of the customer with ecommerce market intelligence. This means integrating data from all touchpoints: the initial ad click, the website sessions, the in-store purchase, and the customer service interactions. An insight might reveal that customers who interact with a product video are 30% more likely to convert. To prove the ROI of creating that video (an action based on an insight), you must be able to track every customer who watched it and see their conversion rate across all channels. This comprehensive approach is essential for calculating the true retail analytics impact.
Attribution Modeling: Assigning Credit Fairly
Modern customer journeys are complex, often involving multiple marketing channels and touchpoints. Simple last-click attribution models fail to give credit to the initial insights and actions that drove awareness or consideration. A multi-touch attribution model (like a U-shaped or W-shaped model) should be used to assign partial credit for the final purchase to the various insights, systems, and teams involved. This ensures that the ecommerce roi calculation via share of search analytics fairly reflects the contribution of the analytics team and the specific insights they provided, solidifying the analytics business case.
Overcoming Common Hurdles in Retail Intelligence Payback Measurement
While the framework is straightforward, implementation can present challenges. Addressing these proactively is key to successful ROI reporting.
The Difficulty of Isolating Long-Term Impact
Some insights don’t pay off immediately. For instance, an insight leading to an improved customer loyalty program might only show its full commerce data value after 12 to 18 months, by reducing churn and increasing CLV.
- Solution: For long-term projects, use leading indicators (proxies for future success) and phased reporting. In the loyalty program example, you can report the short-term ROI based on the uptake rate and early engagement metrics, while reserving the final ROI calculation for when the CLV impact matures. This manages expectations and provides regular updates on the perceived retail intelligence payback.
Cost of Analytics Infrastructure
Including the full cost of analytics infrastructure (software licenses, cloud storage, team salaries) in every single ROI calculation can make individual projects look less profitable.
- Solution: Distinguish between marginal cost and fixed cost. Fixed costs (like annual platform licenses) should be amortized across all projects or treated as a strategic investment. Focus the project-specific ROI calculation primarily on the marginal cost—the extra resources required to execute the specific action (e.g., developer time, specific A/B testing tool fees). The overall analytics business case can then address the amortization of fixed costs over the total incremental revenue analytics generated by all projects.
Securing Future Investment with Proven Ecommerce ROI
The days of viewing commerce analytics as a ‘nice-to-have’ are over. In today’s highly competitive market, the ability to rapidly turn data into profit-driving actions is a fundamental requirement for growth. By adopting a disciplined, four-phase framework for measuring the ecommerce roi of your insights, you transform your analytics function from a supporter of the business into a core financial engine.
Proving the retail analytics impact with concrete figures—isolating the incremental revenue analytics and demonstrating clear category management ROI—is the ultimate way to build an irrefutable analytics business case for continued investment.
The ROI framework in this article only works if your underlying data is accurate, complete, and competitive. 42Signals provides the real-time market intelligence layer competitor pricing, digital shelf analytics, share of search, and VOC data that makes the incremental revenue calculations in Phase 3 reliable rather than estimated. Book a demo and we’ll show you how to calculate the ROI of 42Signals for your specific category in the first session.
FAQs: Understanding the ROI of Commerce Insights
What is the primary focus of measuring ecommerce ROI in the context of analytics?
The primary focus is not just tracking overall revenue, but specifically measuring the ecommerce roi generated by a direct action taken as a result of a specific data insight. This process involves isolating the outcome using methods like A/B testing to calculate the incremental revenue analytics—the extra profit earned that would not have been generated without the insight. The goal is to prove the direct financial contribution of the analytics function.
How is ‘incremental revenue analytics’ different from regular revenue tracking?
Regular revenue tracking shows all sales. Incremental revenue analytics specifically calculates the additional revenue generated by a singular, data-driven change (e.g., a new product recommendation engine). By comparing the performance of a control group (no change) to a test group (change implemented), the difference in sales is attributed solely to the action based on the insight, providing a precise measure of the financial impact and the true commerce data value.
What is the most effective way to make an analytics business case for new tools?
The most effective analytics business case relies on reporting the proven ecommerce roi from existing projects. When proposing a new tool, use historical data to project the potential incremental revenue analytics it could unlock. For example, if your current tools delivered a 300% ROI last quarter, project that a new tool enabling deeper category management ROI analysis could yield an additional $1 million in profit next year by reducing inventory risk and optimizing pricing.
Why is Category Management ROI an important metric for retailers?
Category management ROI is vital because it directly links data insights to margin protection and inventory efficiency. Price benchmarking analytics insights in this area drive decisions on what to stock, where to price, and how to promote. Measuring the ROI here involves quantifying the financial gain from reduced markdowns, improved product mix profitability, and lower stock-out rates, all of which provide clear retail intelligence payback by optimizing the most capital-intensive parts of the retail business.
How often should a business report on its retail analytics impact?
A business should report on retail analytics impact regularly, ideally on a monthly or quarterly basis, depending on the speed of the business cycle. Quick-win insights (like website optimizations) should be reported monthly, showing immediate incremental revenue analytics. Larger, more strategic projects (like supply chain optimizations or CLV improvements) should have quarterly checkpoints and a final ecommerce roi report once the full impact is realized. Consistent reporting keeps the value of the commerce data value visible to stakeholders.