Introduction to eCommerce Analytics
eCommerce analytics is a vital aspect of any online business’s strategy. However, simply having an online store is not enough to guarantee success.
The key to thriving in the competitive eCommerce landscape is understanding your customers and making informed decisions based on data.
As an e-commerce brand, you need to know:
- How available are your key products on popular retail platforms across cities and stores?
- How soon are your products replenished once they go out of stock?
- How easily can shoppers find your products?
- Are your products winning the Buy Box most of the time?
- How do your products compare against those of competitors and category bestsellers in terms of availability, discoverability, and price position?
- What is the consumer perception of your brand?
Let’s explore the essential aspects of eCom analytics and explore how it can drive sales and provide valuable customer insights.
Understanding eCommerce Analytics
eCommerce analytics is the process of gathering, analyzing, and interpreting data from various sources related to your online store. It encompasses everything from website traffic and customer behavior to sales performance and inventory management.
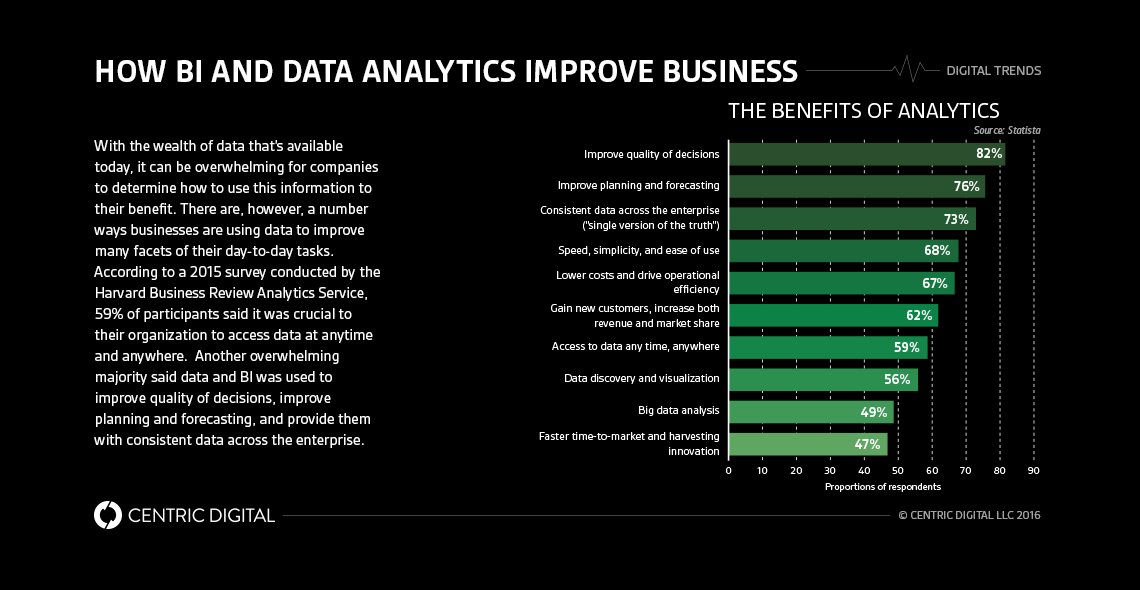
Image Source: Centric Digital
As a brand, your digital shelf performance is measured via key performance indicators (KPIs) such as:
- Availability: are your products in stock?
- Share of Search & Category: what is the proportion (or share) of your products in the search results for specific keywords or category pages?
- Rating and Reviews: how well are your products rated and reviewed?
- Pricing and Promotions: are your products competitively priced and promoted adequately?
Key Metrics in eCommerce Analytics
To effectively utilize eCommerce analytics, it’s crucial to focus on the right metrics. Here are some key performance indicators (KPIs) that can provide valuable insights into your online business:
- Conversion Rate: This metric measures the percentage of visitors who complete a desired action, such as making a purchase. A higher conversion rate indicates a successful website that effectively converts visitors into customers.
- Average Order Value (AOV): AOV calculates the average amount spent by customers per transaction. Increasing the AOV can significantly impact your revenue without needing to acquire new customers.
- Customer Acquisition Cost (CAC): CAC measures the cost of acquiring a new customer. By understanding this metric, you can optimize your marketing budget and focus on channels that provide the best return on investment (ROI).
- Customer Lifetime Value (CLV): CLV estimates the total revenue a business can expect from a single customer throughout their relationship. Maximizing CLV helps in prioritizing retention strategies and long-term growth.
- Churn Rate: This metric tracks the percentage of customers who stop engaging with your business over a specific period. A low churn rate indicates strong customer satisfaction and loyalty.
- Cart Abandonment Rate: This metric shows the percentage of users who add items to their cart but fail to complete the purchase. Reducing cart abandonment can lead to increased sales.
The eCommerce Analytics Checklist

Image Source: GA4
- Google Analytics Integration: This is one of the first and foremost steps and a no-brainer. Set up Google Analytics for comprehensive site traffic and behavior tracking. It shows how users navigate your website and gives you the right insights to optimize your pages. You can configure goals to track conversions and important interactions too. Your website analytics review should be done weekly for the right impact and corrective measures.
- Customer Segmentation Tools: Implement tools for segmenting customers based on behavior, demographics, and purchase history. This helps understand your audience – their demography, psychography, and geography better. Here’s a great list of the tools to get you started. Depending on the customer base, review your data monthly; spikes in traffic or conversions can also trigger an impromptu review.
- Conversion Rate Optimization (CRO) Metrics: Monitor metrics like cart abandonment rate, conversion rate, and click-through rate. It will help narrow down the possibilities of why things aren’t working. If your business receives a lot of orders, monitor this weekly. If you’re just starting out, a monthly analysis should be sufficient.
- Performance Tracking of Marketing Campaigns: Track the performance of different marketing channels (email, social media, PPC). With UTM parameters you can visualize what’s bringing in the traffic and garnering a lot of interest. Analyze open rates, click rates, and conversions from email campaigns with engagement, CTR, and reach for social media. Monitor the metrics of every campaign 2-7 days after it’s been sent and social media traffic weekly.
- Sales and Revenue Critique: Sales and revenue numbers are the crux of a business operation. Reviewing sales data, average order value, time to convert, revenue trends, and repeat customers, can help paint a good picture of your performance. Monitor it monthly and analyze details month-on-month to see changes.
- Product Performance Tracking: Track best-selling items, product views, and inventory levels to know what brings the customer to your business and what makes them stay. A single best-selling product alone can drive traffic to your website and expose customers to other potential items. Monitor such metrics weekly or monthly depending on the order rates.
- User Experience (UX) Analytics: Use heatmaps and session recordings to understand user interactions on your site. Knowing the highest visited pages and the most viewed/interacted parts of the website can help optimize those areas to be more effective. Monitor this data monthly and it can be clubbed with Google Analytics to provide a holistic view.
- Customer Feedback and Reviews: Collect and analyze customer feedback for insights into satisfaction and areas for improvement. A lot of negative feedback on a specific issue should warrant immediate action to resolve that friction point. Likewise, what’s very positive can be set as a benchmark for standards. This can be done either on an ad hoc basis or every two months to ensure nothing’s missed.
- SEO Performance Monitoring: SEO is the backbone of organic traffic and its importance cannot be downplayed. Regularly review search rankings, organic traffic, and keyword performance to see your brand’s performance and compare it with competitors. To know more, have a look at these insights derived from eCommerce data helping businesses improve their practices.
Tools and Technologies for eCommerce Analytics
A variety of tools and technologies are available to help businesses collect and analyze data effectively. Some of the most popular eCom analytics tools include:
- Google Analytics: This free tool offers comprehensive insights into website traffic, user behavior, and conversion rates. It provides valuable information on how visitors interact with your site, helping you optimize the user experience.
- Shopify Analytics: For businesses using the Shopify platform, Shopify Analytics provides detailed reports on sales, customer behavior, and product performance. It also offers integration with other analytics tools for deeper insights.
- Adobe Analytics: Adobe Analytics is a powerful tool that provides advanced analytics and reporting capabilities. It offers in-depth insights into customer journeys, allowing businesses to make data-driven decisions.
- 42Signals: 42Signals is a robust eCommerce analytics tool that helps businesses track customer behavior, segment audiences, and gain insights into market trends. It offers features such as predictive analytics, automated reporting, and integration with multiple data sources, enabling businesses to make informed decisions and drive sales.
Driving Sales with eCommerce Analytics
Let’s explore how it can be used to drive sales and improve business performance.
Personalization and Customer Segmentation
One of the most effective ways to boost sales is by personalizing the shopping experience for your customers.
eCom analytics allows businesses to segment their audience based on various factors, such as demographics, purchase history, and browsing behavior.
By understanding the unique preferences and needs of different customer segments, businesses can tailor their marketing messages. Product recommendations, leading to higher conversion rates and increased customer satisfaction.
Optimizing the Customer Journey

Image Source: Uxpressia
The customer journey encompasses all interactions a customer has with your brand, from the first point of contact to the final purchase. By analyzing the customer journey, businesses can identify pain points and areas for improvement.
For example, if data shows that a significant number of users drop off at the checkout page. Businesses can optimize the checkout process to reduce friction and increase conversions.
eCommerce insights into each stage of the customer journey, enabling businesses to create a seamless and satisfying experience for their customers.
Inventory Management and Demand Forecasting
Effective inventory management is crucial for eCommerce businesses, as it directly impacts customer satisfaction and profitability. eCom analytics can help businesses track inventory levels, identify best-selling products, and predict demand patterns. By analyzing historical sales data and market trends, businesses can make informed decisions about stock replenishment and avoid overstocking or understocking issues. This ensures that products are always available to meet customer demand, leading to higher sales and improved customer loyalty.
Pricing Optimization
Pricing is a critical factor that influences purchasing decisions. eCommerce analytics can help businesses optimize their pricing strategies by analyzing competitor prices, market trends, and customer behavior. Dynamic pricing models, powered by real-time data, allow businesses to adjust prices based on demand fluctuations, competitor actions, and other external factors. By implementing pricing strategies that align with customer expectations and market conditions, businesses can maximize their sales and revenue.
Enhancing Marketing Campaigns
Marketing campaigns play a crucial role in attracting and retaining customers. eCom analytics provides valuable insights into the effectiveness of marketing efforts, allowing businesses to optimize their campaigns for better results.
By tracking metrics such as click-through rates, conversion rates, and customer acquisition costs, businesses can identify high-performing channels and allocate resources accordingly. A data-driven marketing approach enables businesses to reach the right audience with the right message, ultimately driving more sales and increasing brand awareness.
Improved Lead Acquisition
Data-driven solutions are instrumental in implementing a successful data-driven approach to lead generation in e-commerce. Here’s how they can assist brands in winning the buy box:
- Data Insights: These solutions provide data on pricing, availability, and seller performance, enabling brands to make immediate adjustments to improve their chances of securing the buy box.
- Competitor Analysis: Brands can gain insights into their competitors’ strategies and pricing, allowing them to adjust their own strategies accordingly.
- Predictive Ecommerce Analytics: Data-driven tools can predict when products are likely to run out of stock, helping brands proactively replenish inventory.
- Performance Dashboards: Brands can track their seller performance metrics on easy-to-read dashboards, making it easier to identify areas that need improvement.
Gaining Customer Insights with Actionable Insights
In addition to driving sales, analytics offers valuable insights into customer behavior and preferences. Understanding your customers is key to building strong relationships and fostering brand loyalty.
Analyzing Customer Feedback
Customer feedback, whether through reviews, surveys, or social media, provides valuable insights into customer satisfaction and areas for improvement.
eCommerce analytics tools can help businesses aggregate and analyze customer feedback, identifying common themes and sentiments. By addressing customer concerns and implementing changes based on feedback, businesses can enhance the customer experience and build trust with their audience.
Understanding Customer Behavior
eCom analytics allows businesses to track and analyze customer behavior across various touchpoints. By understanding how customers navigate the website, what products they view, and how long they spend on each page, businesses can gain insights into customer preferences and interests. This information can be used to optimize website design, improve product recommendations, and create targeted marketing campaigns that resonate with customers.
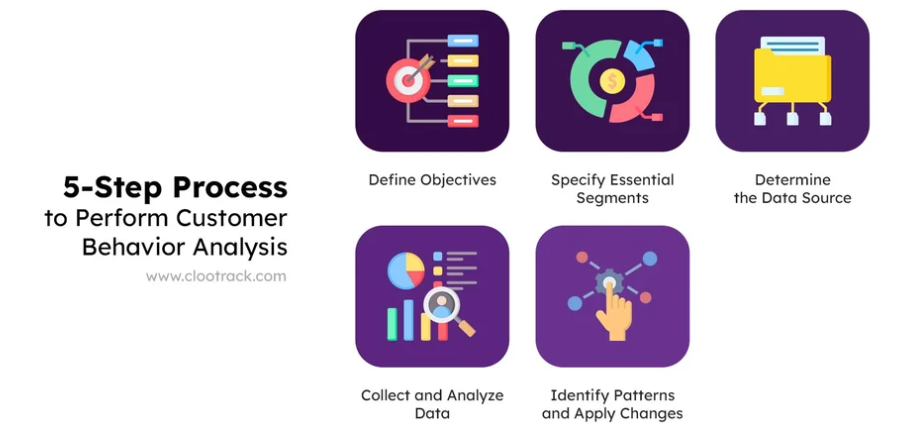
Source: ClooTrack
Identifying Trends and Opportunities
The eCommerce landscape is constantly evolving, with new trends and opportunities emerging regularly. eCommerce analytics enables businesses to stay ahead of the curve by identifying emerging trends and market opportunities.
By analyzing data from various sources, such as social media, search engines, and industry reports, businesses can understand trends and meet customer demands before their competitors.
42Signals’ Role in Empowering Businesses
42Signals plays an instrumental role in empowering eCommerce businesses with bespoke analytics solutions. It offers advanced analytics solutions that provide deep insights into customer behavior and purchasing patterns. By analyzing this data, they help eCommerce businesses understand what drives their customers, enabling them to tailor product offerings more effectively. This level of customization is not just about improving sales; it’s about creating a shopping experience that resonates with customers.
From identifying the most profitable products to understanding seasonal trends, their analytics enable businesses to make informed decisions about inventory management, pricing strategies, and marketing campaigns. This ability to turn data into actionable insights is invaluable.
If you’re looking for a tool that provides concise and intelligible insights about the industry, category, and products, schedule a demo today.
FAQs
Which eCommerce Analytics Tool is the Best and Why?
The “best” eCommerce analytics tool often depends on the specific needs of your business, including the size of your eCommerce operation, the complexity of the data you wish to analyze, and your budget. However, a commonly recommended tool is Google Analytics. For granular insights specific to products, competitors, and customers, 42Signals is a great fit.
What are the Best eCommerce Analytics Tools?
Several eCommerce analytics tools are highly regarded in the industry, each offering unique features. Some of the best include:
- Google Analytics: Ideal for a broad range of analytics needs, offering both a free and a premium version.
- Kissmetrics: Known for its customer-centric approach, it provides detailed insights into individual customer behaviors and is excellent for understanding customer journeys and improving conversion rates.
- Adobe Analytics: Part of the Adobe Marketing Cloud, it’s a powerful tool for larger businesses with more complex data analysis needs. It excels in segmenting and visualizing data.
- Mixpanel: Focuses on tracking user interaction with products. It’s particularly useful for mobile analytics and tracking events.
- Woopra: Known for real-time analytics and customer journey tracking. It’s excellent for businesses focused on optimizing the customer experience.
- Shopify Analytics: For businesses using Shopify as their eCommerce platform, Shopify Analytics is a tailored solution that integrates seamlessly with the platform.
- BigCommerce Analytics: Similar to Shopify Analytics, this is ideal for BigCommerce users, offering insights specific to the platform.
What are the 3 C’s of eCommerce?
The 3 C’s of eCommerce represent the core elements required to build and grow a successful online business:
- Content – Informative and engaging content that educates, persuades, and ranks well in search engines.
- Examples: Product descriptions, blogs, videos, and reviews.
- Commerce – The actual transaction process including shopping cart, checkout, payment gateways, and order fulfillment.
- Think: Secure payment systems, shipping logistics, and returns management.
- Community – Building brand loyalty and customer engagement through interactions, feedback, and social proof.
- Includes: User reviews, loyalty programs, email lists, and social media engagement.
What are the three pillars of the e-commerce model?
The three pillars of a successful e-commerce model represent the foundational structure behind online retail operations:
- Technology & Infrastructure
- This includes the e-commerce platform (like Shopify or Magento), hosting, inventory systems, and integrations that support operations.
- Without strong infrastructure, scaling becomes difficult.
- Customer Experience (CX)
- Encompasses website usability, personalization, mobile responsiveness, fast shipping, and support — everything that affects how customers feel when shopping.
- Great CX turns one-time buyers into loyal customers.
- Data & Analytics
- Leveraging customer behavior, sales trends, and traffic data to make informed decisions about marketing, pricing, and product development.
- Data-driven brands outperform those that rely on guesswork.