
Many companies today focus on bold advertising, packed product features, and intense sales strategies to stay ahead. But sometimes, the biggest wins come from something far simpler — listening to what’s bothering your customers. Turning this data helps with product optimization, which then drives sales.
Customer complaints, questions, and struggles aren’t just for the customer service department. It often highlights experiences and points where your product can improve, and specifically, what’s missing. When it’s looked at thoughtfully, these pain points lead to smarter decisions that eventually lead to better customer loyalty and soaring profits.
With the right mix of listening, analyzing, and acting on feedback, product optimization can become an easy process that drives the right results. Tools like digital shelf insights, ecommerce analytics, and the right pricing data help turn feedback into real growth.
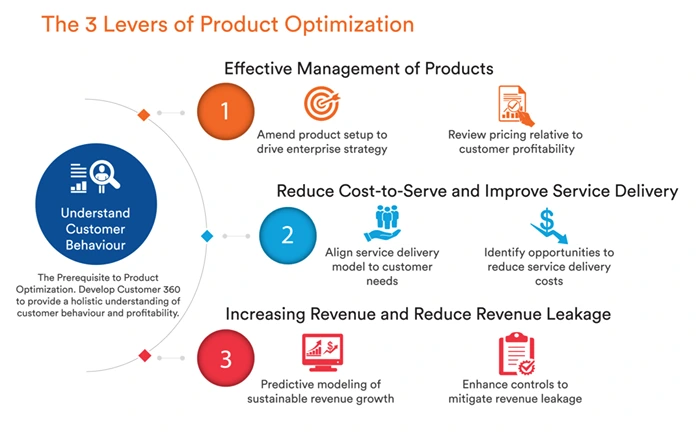
Image Source: Optimus SBR
Product Optimization – Why Solving Customer Pain Makes Business Sense
Customer frustrations are more than temporary setbacks — they affect how people spend, return, and talk about your product. Here’s what actually happens when you pay attention –
- Customers stay longer: Solving a problem makes people more likely to stay. Retaining a customer costs far less than winning over a new one.
- Happy Customers Spread the Word: People who feel heard often become your best promoters. Resolving their issues builds trust and word-of-mouth referrals.
- You Can Charge What You’re Worth: When your product runs smoothly and meets expectations, customers are more willing to pay a bit more.
- Fresh Ideas Take Shape: Repeated frustrations can reveal what’s missing — and that could be your next feature, service, or product.
- Efficiency Improves: Often, pain points point to internal slowdowns. Fixing them saves time and money. Pro Tip: 42Signals’ voice of customer analytics can help brands understand this data.

Research shows that companies that are focused on actually improving the customer journey, on the frustrating parts, grow faster and reduce churn. A McKinsey study found that revenue went up by 10-15% and service costs dropped by 15–20% when businesses prioritized key moments in the customer experience.
A Clear Process for Product Optimization
Solving customer pain takes a focused, four-step process –
Step 1: Find the Real Issues
Start by identifying problems — not just the loudest ones, but the most common and meaningful. Look at –
- Direct Feedback Channels:
- Customer Support Logs: Get data from tickets, chats, and any recordings from speaking to customers. Look for any recurring themes, and not just individual issues. What words do customers consistently use?
- Surveys & NPS: Go beyond scores and analyze comments. Ask specific questions about friction points in key journeys (purchase, onboarding, usage, support).
- User Interviews & Focus Groups: Dig deeper to reveal the emotional context and underlying motivations behind pain points that surveys might miss.
- Social Media Listening: Monitor brand mentions, competitor mentions, and industry hashtags. Tools can help aggregate sentiment and identify trending frustrations.
- Indirect & Behavioral Signals:
- Digital Shelf Analytics: This is crucial for physical and CPG products sold online. Monitor product detail pages (PDPs) across retailers (especially Amazon, Walmart, Target). Low conversion rates, high bounce rates on your PDPs, or negative sentiment in reviews specifically mentioning product attributes (e.g., “hard to open,” “spoiled quickly,” “instructions unclear,” “packaging wasteful”) are glaring pain point indicators. CPG Analytics platforms specialize in aggregating this data across the digital shelf.
- Amazon Data & Reviews: Amazon is a goldmine. Analyze your own product reviews meticulously (using sentiment analysis tools). But also analyze competitor reviews!
- What are customers complaining about in your category?
- What unmet needs or frustrations are expressed?
Look at Q&A sections. Track review volume trends – a sudden spike in negatives signals a potentially widespread issue. Amazon data (via Brand Analytics, third-party tools) provides insights into search terms (what problems are people trying to solve?), conversion funnels, and lost buy-box percentages indicating friction.
- Quick Commerce Data: For categories relevant to instant delivery (groceries, snacks, essentials, OTC meds), quick commerce data reveals friction points unique to speed.
- Are items frequently out of stock on these platforms?
- Are delivery times inaccurate?
- Is packaging insufficient for rapid transit?
- Are products failing the “instant need” test (e.g., hard-to-open packaging when you need painkillers now)?

This data highlights pain points amplified by the immediacy expectation.
- Website & App Analytics (For Digital Products & DTC): Funnel drop-off points (especially checkout abandonment), feature usage heatmaps showing areas of confusion, session recordings revealing user struggle, and high error rates pinpoint exactly where users encounter friction.
- Returns & Complaint Analysis: Why are products being returned? What specific reasons are given? This is direct feedback on product failure to meet expectations or inherent flaws.
Step 2: Understand What’s Really Causing the Problems
Not all complaints point to the core problem. A complaint about “slow delivery” might stem from inefficient warehouse processes, a carrier issue, or unrealistic delivery promises on the website.
- The “5 Whys” Technique: Keep asking “why” to drill down from the symptom to the fundamental cause.
- Journey Mapping: Visually map the customer’s entire experience with your product/service. Identify every touchpoint where the identified pain point manifests and analyze the contributing factors at each stage. Where does the friction originate?
- Data Correlation: Cross-reference pain point signals.
- Does a spike in negative reviews about product durability correlate with a specific batch code or manufacturing date (requiring deeper CPG analytics linking production to quality)?
- Does checkout abandonment correlate with specific payment methods or shipping cost thresholds revealed by retail pricing analytics experiments?
- Prioritization (The ICE Framework): Not all pain points are equal. Prioritize based on:
- Impact: How many customers are affected? How severely does it impact their experience or willingness to buy/repurchase?
- Confidence: How sure are you about the data and the root cause?
- Ease: What is the estimated effort and cost to resolve?
Step 3: Optimizing the Product & Experience – Designing the Solution
- Product Design & Features: Address functional flaws, improve usability, and add features that directly alleviate the pain (e.g., easier-open packaging identified via digital shelf analytics reviews, clearer instructions, more durable materials).
- Packaging Optimization: For CPG, packaging is part of the product. Solve pain points like difficulty opening, resealing, storage, portioning, or waste (common themes found in Amazon data reviews). Ensure it survives quick commerce delivery.
- Pricing & Value Alignment: Retail pricing analytics is critical here.
- Does the price reflect the value after the pain point is resolved?
- Can you justify a premium?
Conversely, if the pain point is significant, does the price need adjustment? Analyze price elasticity and competitor pricing data to optimize. Bundling products that solve related pains can also create value.
- Support & Education: Sometimes the solution isn’t changing the product but improving how customers use it. Create better onboarding, tutorials, FAQs, or proactive support interventions targeting the identified friction.
- Process Improvements: Address internal inefficiencies causing the pain (e.g., streamlining order fulfillment to meet quick commerce promises, improving quality control flagged by CPG analytics).
- Communicating the Fix: Don’t just fix it; shout about it! Update product descriptions, highlight the improvement in marketing, and respond to reviews mentioning the old pain point to announce the solution. Leverage digital shelf analytics to ensure your PDPs accurately reflect the optimization.
Step 4: Monetizing the Resolution – Capturing the Value
Solving the pain creates value; now capture it strategically:
- Increased Market Share & Customer Acquisition: A superior, frictionless experience is a powerful acquisition tool. Market your solution as a key differentiator (“Finally, an X that doesn’t do Y!”).
- Price Premiums: Customers pay more for products that solve their real problems effectively and reliably. Use retail pricing analytics to test and validate new price points post-optimization. Data showing reduced returns or increased loyalty support premium pricing.
- Enhanced Customer Lifetime Value (CLTV): Reduced churn and increased repurchase frequency significantly boost CLTV. Loyal customers buy more, more often, and are less price-sensitive.
- Reduced Costs: Lower return rates, fewer support tickets related to the resolved issue, and improved operational efficiency directly improve the bottom line. CPG analytics can track reductions in waste or returns.
- New Revenue Streams: The solution itself might become a sellable feature, service, or even spawn a new product line addressing a broader need uncovered during diagnosis.
- Competitive Moat: Being the first to effectively solve a widespread industry pain point creates a significant barrier to entry and cements market leadership.
The Critical Role of Advanced Analytics for Product Optimization
As evident throughout, data isn’t just supportive; it’s foundational to this entire profit engine:
- Digital Shelf Analytics & CPG Analytics: Provide real-time, granular insights into how products are perceived, discovered, and purchased online across multiple retailers. They identify pain points expressed in reviews, track share of voice vs. competitors, monitor out-of-stocks (a major pain point!), and measure the impact of optimizations on conversion and sales velocity.
- Amazon Data: Offers unparalleled depth into customer sentiment (reviews, Q&A), search behavior (revealing intent and problems), competitive dynamics, and operational performance (fulfillment, buy box) on the world’s largest marketplace. It’s often the richest source of unsolicited customer feedback.
- Quick Commerce Data: Illuminates the unique demands and friction points of instant delivery. It highlights stockout issues, packaging failures under speed pressure, and purchase patterns driven by immediate need, requiring different optimization strategies.
- Retail Pricing Analytics: Empowers data-driven pricing decisions before, during, and after addressing pain points. It helps determine the value of the solution to the customer (what premium can it command?), optimizes promotions, identifies competitive threats, and measures the direct revenue impact of pricing changes linked to CX improvements.
Building a Pain-Point-Centric Culture
Sustained success requires embedding this approach into your company’s DNA, which involves you to –
- Break Down Silos: Pain points span departments. Marketing, Product, Sales, Support, and Operations must share data and collaborate on solutions. Centralized dashboards powered by the aforementioned analytics are key.
- Empower Frontline Teams: Support and sales teams hear the pain first. Give them channels to escalate insights easily and see how their feedback leads to change.
- Close the Feedback Loop: Tell customers you heard them and fixed the problem. Respond to reviews announcing the fix. This builds immense goodwill.
- Measure What Matters: Track KPIs directly linked to pain point resolution: Reduction in specific complaint types, decrease in return rates for specific reasons, improvement in NPS/CSAT scores, increase in repurchase rate, change in review sentiment, conversion rate lift on optimized journeys, and ultimately, revenue growth and margin improvement attributable to these initiatives.
- Invest in the Right Tools: Implement robust platforms for digital shelf analytics, CPG analytics, Amazon data aggregation, quick commerce data monitoring, and retail pricing analytics. The ROI comes from the actionable insights they provide.
Pain is Not Inevitable, It’s an Opportunity
Customer pain points are not static annoyances; they are dynamic signals pointing towards the most impactful areas for product optimization.
By systematically listening (using both direct feedback and sophisticated digital shelf analytics, CPG analytics, Amazon data, and quick commerce data), diagnosing root causes, designing targeted solutions, and strategically monetizing the resolution (informed by retail pricing analytics), businesses unlock a powerful engine for growth and profitability.
This approach moves beyond reactive firefighting to proactive value creation. It transforms frustrated customers into loyal advocates and turns operational friction into a source of competitive advantage.
Sign up to see 42Signals in action and learn how product optimization can be quickly implemented with the right product dashboards.