The consumer packaged goods (CPG) industry is racing against time. With shoppers demanding faster deliveries, personalized experiences, and seamless online-to-offline interactions, brands are scrambling to stay relevant. The secret weapon? CPG analytics.
Tools like ecommerce insights and quick commerce data are rewriting the rules of competition. Let’s dive into how analytics is fueling innovation, with a focus on gritty details like product data tracking, map violations, and share of search.
CPG Analytics: The Unsung Hero of Consumer Brands’ Survival
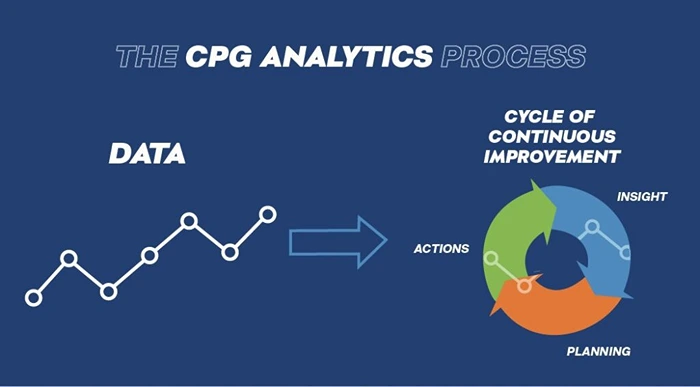
Image Source: Alliance Sales and Marketing
Picture this: A snack brand discovers that its new keto-friendly chips are flying off shelves in Texas but gathering dust in New York. How? CPG retail analytics crunches point-of-sale data, inventory turnover rates, and even local weather patterns to pinpoint regional demand shifts.
Take product data tracking, for example. Brands like PepsiCo and Unilever monitor millions of SKUs daily to spot trends. But here’s the issue: Retailers often undercut agreed pricing, causing MAP violations (Minimum Advertised Price breaches).
These violations aren’t just annoying, they erode trust with distributors and crush margins. One Midwest beverage company told us, “We used to spend weeks manually scouring Amazon for price cheats. Now, AI tools flag violations in real time. Our enforcement team acts before the damage spreads.”
The real magic is in bringing everything together. Imagine a shampoo brand using TikTok trends to push a new coconut-infused line in cities where in-store stock is high. Analytics bridges the gap between digital hype and physical inventory, turning viral moments into sales.
Digital Shelf Analytics: Where Online Battles Are Won or Lost
Walk down any grocery aisle, and you’ll see products jostling for attention. Now imagine that chaos on Amazon. Digital shelf analytics is the CPG equivalent of a superhero cape—it gives brands X-ray vision into their online performance. Metrics like share of search (how often your brand pops up in relevant searches) can make or break a product.

Here’s a reality check: If your product page on Walmart.com has blurry images or missing keywords, shoppers bounce. One yogurt brand learned this the hard way. Their “low-sugar” claim was buried in the description on Instacart, leading to a 20% drop in conversions. After using product data tracking tools to fix inconsistencies, sales rebounded in weeks.

But the digital shelf isn’t just about aesthetics, it’s about making sure all aspects of the product cycle are in sync with the right analytics. A baby formula brand once faced a recall because its Amazon listings omitted a “non-GMO” certification. Digital shelf tools can now auto-scan for these errors, saving millions in penalties and protecting brand trust.
Real-World Hack: A pet food company analyzed competitor pricing during Prime Day and noticed a rival slashing prices on grain-free kibble. They countered with a lightning-fast promo, leveraging ecommerce insights to boost sales by 35% without sacrificing margins.
Ecommerce Insights in CPG Analytics: Cracking the Code of Consumer Behavior
Online shopping has become the norm for several years now. But here’s what most brands miss: ecommerce insights aren’t just about tracking clicks. They’re about predicting what shoppers want before they know it and looking at ways to optimize product presence in relation to the category and competitors.
Consider “quick commerce” apps like Gorillas or Getir, or Blinkit by Zomato, which deliver snacks in 10 minutes. These platforms generate quick commerce data that’s pure gold. A soda brand in Miami used this data to stock extra cans in neighborhoods before weekend heatwaves hit. Result? A 50% sales spike.
The Psychology of Immediacy and Predictive Response
The rise of “quick commerce” platforms has fundamentally rewired expectations. The success story of the Miami soda brand capitalizing on heatwave data is a perfect example of moving from reactive to predictive analytics. This isn’t just about weather; it’s about understanding the contextual triggers that drive purchases. For instance, data could reveal that sales of a specific brand of popcorn spike during movie trailer releases on YouTube, or that a particular shade of home paint gains traction after features in popular home renovation TikToks. By analyzing these quick commerce and social sentiment data streams, brands can position products not just where the customer is, but when they are most psychologically primed to buy.
Personalization: Beyond the Basic Bundle
The coffee and mug bundle illustrates effective personalization, but the next frontier is psychographic segmentation. Advanced analytics can cluster customers not just by what they buy, but by their values and lifestyles. A consumer who consistently buys eco-friendly cleaning supplies, oat milk, and recycled paper products is signaling a clear identity. A brand can tailor its entire communication strategy—from email marketing to targeted ads—to resonate with this “Eco-Conscious” segment, offering them products and content that align with their worldview, thereby fostering deeper loyalty that transcends price.
The Perils of Algorithmic Over-reliance
The dynamic pricing mishap in CPG analytics underscores a critical lesson: data must be guided by brand strategy and empathy. Algorithms optimize for short-term revenue, not long-term customer relationships. A more nuanced approach is to use pricing data defensively, to ensure brand consistency and combat MAP violations, while using personalization and promotion data offensively to reward loyalty. For example, instead of raising prices for everyone during high demand, a brand could use its customer data to offer “loyalty member” pricing, making valued customers feel seen and appreciated rather than exploited.
The New Consumer Touchpoints: Voice and Visual Search
The frozen pizza brand’s success with voice search optimization highlights a shift in how consumers initiate their shopping journeys. The language used in voice queries is often more natural and long-tail (“best gluten-free pizza for kids”) compared to typed keywords (“gluten-free pizza”). Brands must now optimize their product content for this conversational syntax. Similarly, the growth of visual search on platforms like Pinterest and Google Lens means that a product’s imagery is becoming a primary search entry point. Ensuring high-quality, distinctive packaging and product photos that are easily indexed by AI is no longer a marketing bonus—it’s a discovery necessity.
In essence, modern consumer behavior is a continuous feedback loop of desire, discovery, and delivery. Brands that listen intently to this loop—using data to understand the psychological triggers, ethical values, and evolving search habits of their audience—will be the ones that not only respond to the market but actively shape it.
MAP Violations: The Silent Profit Killer
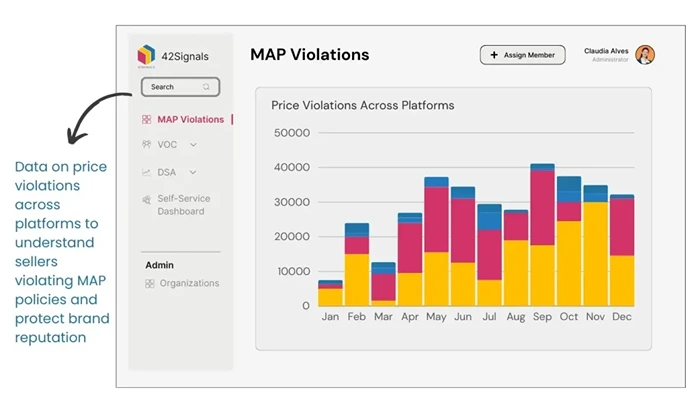
MAP violations are hard to eradicate and are everywhere. Unauthorized sellers on eBay or Facebook Marketplace often slash prices, infuriating authorized retailers. The immediate effect is the devaluation of the brand in the consumer’s eyes, making it difficult for authorized retailers—who invest in marketing, customer service, and brand storytelling—to compete. As one cosmetics executive noted, discovering a seller hawking serums at a 40% discount not only hurts sales but often uncovers a deeper issue in the supply chain, such as diverted or even stolen goods.
The consequences extend far beyond a single sale. Persistent MAP violations erode retailer trust, leading them to deprioritize your brand or drop it altogether. They also train customers to wait for discounts, destroying your ability to command a premium price. Manually policing these violations is a Sisyphean task; the internet is too vast, and sellers are too agile.
This is where modern ecommerce analytics platforms become a force multiplier. Tools like 42Signals deploy advanced web scraping and AI to monitor pricing across hundreds of global platforms in real-time, identifying violations by the minute. The sports nutrition brand that cut violations by 90% did so by moving beyond manual checks to an automated system that issues immediate takedown requests and provides forensic data to trace violations back to their source. This proactive enforcement doesn’t just protect margins; it safeguards the brand equity and retailer relationships that took years to build.
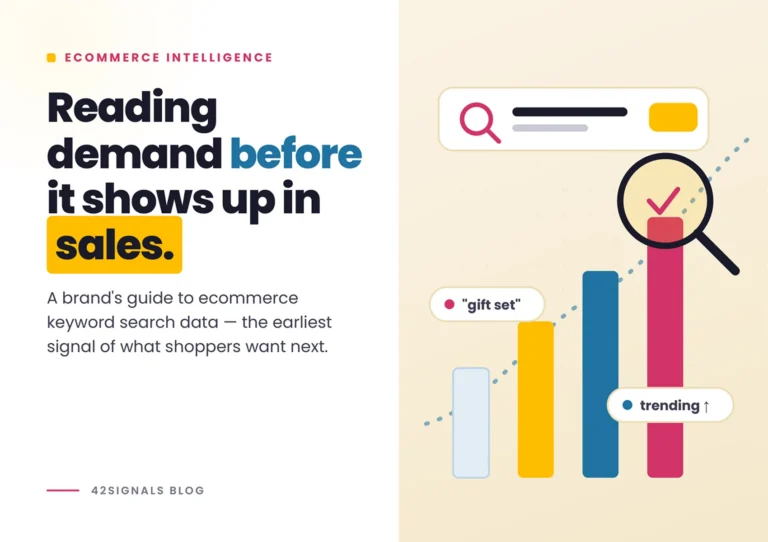
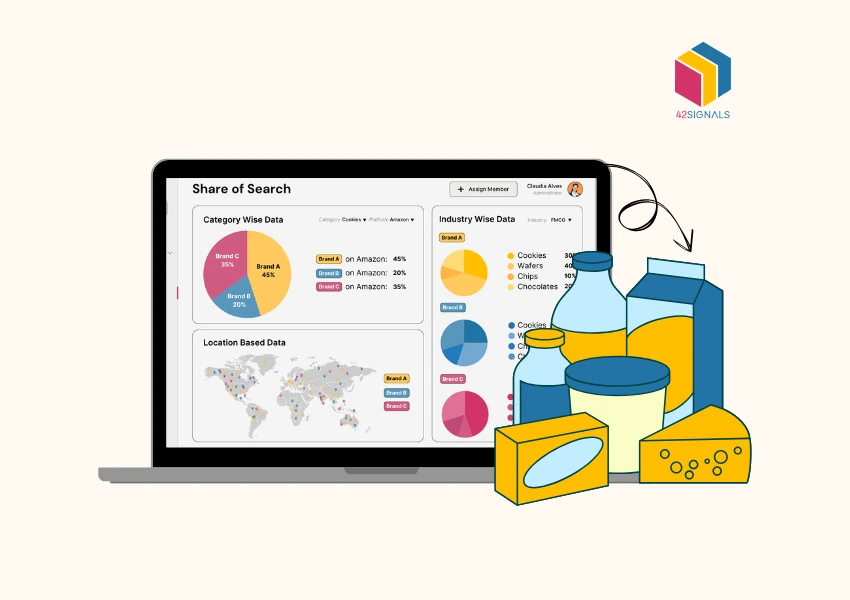
Share of Search: The Crystal Ball of CPG Analytics
Forget market share—share of search is the metric du jour. It measures how often your brand appears in search results for terms like “organic snacks” or “vegan shampoo.” Google Trends shows this data, but savvy brands go deeper with platform-specific insights.
A cereal company noticed its share of searches tanked every September. Turns out, parents were hunting for protein-packed breakfasts during back-to-school season. They launched a high-protein line with TikTok-ready packaging, dominating searches by January.
However, mastering Share of Search requires a multi-layered approach. It’s not enough to track your own brand; you must benchmark against competitors to understand who is gaining mindshare and why. The frozen pizza brand’s success with voice search highlights a critical evolution: Share of Search now extends beyond traditional text-based Google queries. It includes voice search on smart devices, visual searches on social media, and even queries within specific marketplaces like Amazon. Optimizing for these new frontiers means creating content that answers questions directly and using natural, conversational language that aligns with how people actually speak.
The Road Ahead: AI, Sustainability, and Analytics
The future of CPG analytics is hyper-intelligent, ethical, and seamlessly integrated. Artificial Intelligence will evolve from a reactive tool to a predictive partner. Imagine smart shelves with weight sensors that trigger automatic reordering, or IoT-enabled product packaging that sends usage data back to the brand, alerting you when a customer is likely running low on laundry pods and sending a timely, personalized offer.
Sustainability is another frontier. A detergent brand used analytics to redesign its supply chain, cutting emissions by 25%. They even tracked which eco-labels (“recyclable” vs “compostable”) resonated most, tweaking packaging based on real-time feedback. This allows for evidence-based packaging and reformulation choices that resonate with the values of specific customer segments.
Ultimately, the winners in the new ecommerce landscape will be those who break down data silos. The most powerful insights will come from correlating MAP compliance data with Share of Search trends, and layering that with quick commerce sales velocity. This integrated view reveals the complete picture: how protecting your price point (MAP) strengthens your brand perception (Share of Search), which in turn drives sales across all channels, from quick commerce to retail.
Data Is the New ‘IT’
In the modern CPG arena, data analytics is no longer a support function; it is the core strategic capability. Whether it’s eradicating the profit drain of MAP violations, using Share of Search to anticipate market shifts, or harnessing AI for sustainable innovation, the brands that thrive will be those that embed a data-first mindset into every decision.
This requires treating analytics not as a periodic project but as a continuous, company-wide effort. In this environment, leveraging comprehensive tools like 42Signals to understand the right data at the right time isn’t just an advantage—it’s the fundamental requirement for survival and growth.
If you’re curious to try our tool, sign up today.
Frequently Asked Questions
What is CPG analytics?
CPG analytics (Consumer Packaged Goods analytics) refers to the use of data and advanced analytical tools to understand, predict, and optimize business performance in the fast-moving consumer goods (FMCG) industry.
It helps CPG brands track everything from consumer behavior, product performance, and pricing trends to supply chain efficiency and retail shelf visibility.
By analyzing sales data, retailer feeds, market share, and promotions, companies can:
- Forecast demand and manage inventory more accurately.
- Optimize pricing and promotions in real time.
- Identify which channels or SKUs drive profitability.
- Improve marketing ROI and customer engagement.
For example, a beverage brand might use CPG analytics to identify which flavors perform best in specific regions and adjust its distribution and advertising accordingly.
What is the meaning of CPG?
CPG stands for Consumer Packaged Goods — everyday products that customers use frequently and replace regularly.
Examples include food, beverages, personal care, household cleaning items, and toiletries. These goods are typically sold through retailers, supermarkets, and e-commerce platforms rather than direct manufacturers.
The CPG industry is characterized by:
- High sales volume but often low profit margins per unit.
- Strong competition and price sensitivity among consumers.
- A reliance on brand recognition and availability to drive loyalty.
Companies like Procter & Gamble, Nestlé, Unilever, and PepsiCo are global leaders in this space.
What are the 4 types of analytics?
The four main types of analytics used across industries—including CPG—are:
- Descriptive Analytics – Explains what happened by analyzing historical data.
Example: Monthly sales performance by SKU or region. - Diagnostic Analytics – Examines why it happened by identifying root causes or correlations.
Example: Understanding why a product’s sales dipped after a price change. - Predictive Analytics – Uses machine learning and historical data to forecast what might happen next.
Example: Predicting next quarter’s demand or customer churn risk. - Prescriptive Analytics – Recommends what to do by suggesting optimal strategies or actions.
Example: Suggesting the best discount strategy for maximum margin without losing volume.