

NEW REPORT - How did Dussehra prices differ across Indian cities? Download our report to find out!
Prices move, sellers undercut your floor, SKUs vanish from a dark store two pin codes over, a competitor takes your keyword. 42Signals captures every one of those events across Amazon, Flipkart, Blinkit, Zepto, Instamart, Walmart, Target, Instacart and 20+ more — then tells you which ones are costing you money.
SKUs under watch
consumer brands
retailers & marketplaces
continents covered
fastest refresh cadence













Five modules, two markets, every field we collect. Switch between them the way your team would on a Monday morning: pricing first, then whatever the category manager is shouting about.
The listing as a shopper sees it
Product titleBrandASIN / FSN / SKU IDCategory pathImage countBullet countDescription lengthA+ content flagVariant countPack sizeListing quality scoreContent change log
Every number that moves margin
MRPSelling priceDiscount %Coupon valueBank / card offerBundle priceSubscribe & savePrice historyChange velocityMAP floorGap to floorViolation durationScreenshot evidence
Down to the dark store
In-stock flagExposed stock countPin-code availabilityDark-store coverageDelivery ETAOOS durationRestock lagFulfilment typeShipping feeEstimated lost sales
Who owns the first screen
Organic rankSponsored rankShare of searchShare of shelfRank by pin codeKeyword volumeAd placement typeCompetitor occupancyBanner & deal placementCategory rankBest-seller badge
Who else is selling you
Seller nameSeller IDSeller count per SKUBuy-box ownerSeller ratingAuthorised flagFirst seen / last seenGrey-market signalRepeat-offender score
What the shelf is being told about you
Star ratingReview countRating distributionVerbatim textReview velocityTheme tagsSentiment scoreAspect sentimentReturn-risk signalCompetitor review deltas
National in-stock percentages hide the problem. A SKU can read 94% available and still be missing from every dark store serving your highest-AOV clusters. We collect at the delivery-address level, so availability, rank and price are all answerable by pin code.
A dashboard nobody opens is a cost centre. Most of the value shows up in the alert that reaches a key account manager before the platform team does something about it.
Threshold breaches pushed in near real time — price below floor, SKU out of stock, rank drop past a set position.
The five modules on this page, filtered to your brands, categories and platforms.
The full attribute set as JSON or CSV, on your cadence, into your own warehouse.
Straight into Power BI, Tableau or Looker so it sits next to your sell-out data.
Catch floor breaches and discount wars in hours instead of at month-end reconciliation.
Walk into the platform review with availability and rank evidence the buyer can't dispute.
Tie share of search and sentiment movement back to the campaign that caused it.
Send us a SKU list and the platforms that matter. We’ll run it and walk you through what we found — your actual prices, your actual stockouts, your actual search share. No slideware.
A real person from the team, not a sequence. We confirm scope and platforms.
Up to 100 SKUs across the platforms you name, using live data.
We open the dashboard on your data and you tell us what's wrong with it. Commercials only if it's useful.
Takes about 40 seconds.

Empowering clients with smart insights for a better future. Get eCommerce insights on promotions, product stocks, and market trends. 42Signals equips consumer brands with rich data to turn customer insights into retail excellence.
COMPANY
RESOURCES
NEWSLETTER

We at 42Signals are committed to GDPR compliance and the secure handling of your data. We guarantee that your information is never shared with external parties and is never stored or processed beyond its necessary purpose.

• THIS WEEK ON YOUR SHELF
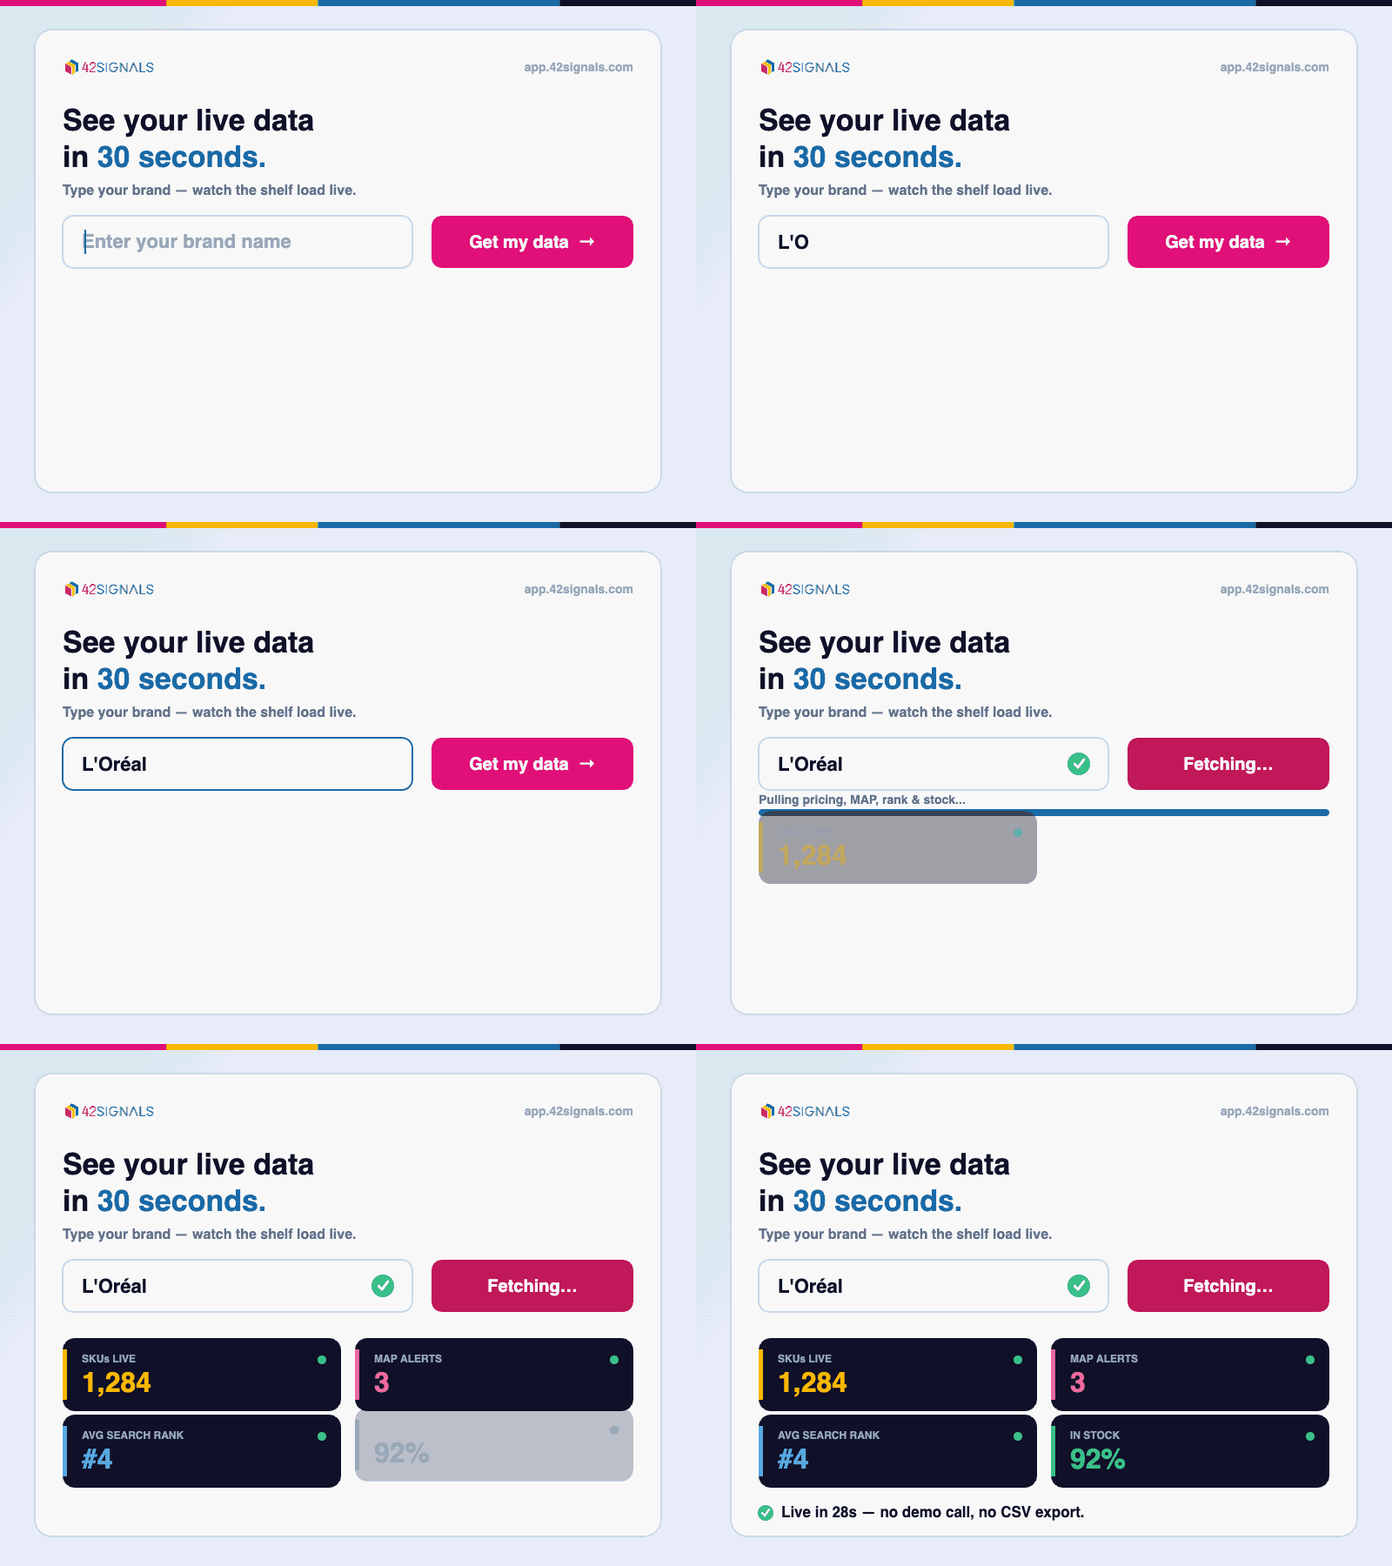
Unlock near real time digital shelf data, map violation, and competitor moves. Create your free account below.
🛡️ Free Instant Access • No Credit Card Needed
www.42signals.com
200+ Brands • 18M+ SKUs • 20+ Retailers • 4 Continents
www.42signals.com