

NEW WEBINAR - Unauthorized sellers are listing your products right now. Do you know who they are?
Duration · 10 Mins
One seller drops below MAP. Within hours, automated repricers react, the Buy Box shifts, and your entire category collapses to a new price floor about 15 to 20% below where you started. This webinar shows you how to see it coming before it costs you.













in every price war spiral — from the first undercut to full category collapse
is all it takes for automated repricers to react to a single sub-MAP listing
below MAP — the new price floor a category resets to after an uncontrolled spiral
early warning trip wires that give you a window to intervene before collapse
A price war isn’t a single decision. It’s usually an automated chain reaction. Understanding each stage is the difference between catching it in hours and discovering it weeks later when the damage is done.
The webinar covers exactly how to detect the first sub-MAP listing in real time and the enforcement actions that prevent stages 2, 3, and 4 from ever occurring.
First sub-MAP listing appears
Repricers react
Buy Box shifts to lowest seller
Category resets to new floor
You check the spreadsheet
A 15% price drop over 3 days across a few hundred units equates to tens of thousands in lost revenue value — before you even factor in long-term brand perception damage.
The tools most brand teams rely on weren’t built for the speed at which price wars move.
Weekly manual spot checks
A snapshot taken on Monday morning tells you nothing about the spiral that started on Wednesday and collapsed by Friday. By the time you see the data, the enforcement window has long closed.
Basic price scrapers
Most scraping tools run once or twice daily and only capture listed prices. They can’t track seller count changes, Buy Box shifts, or price velocity — the signals that actually predict a spiral.
Reacting after the fact
Even fast manual responses are reactive by nature. Without automated trip wires, you’re always in recovery mode — not prevention mode. Recovery costs far more in time, margin, and seller relationships.
A sudden appearance of unfamiliar sellers in your category. Unauthorized or grey-market distributors are often the first mover in a price spiral they have no brand relationship to protect.
Signal 01
The very first instance of any price drop below your established floor. This is the critical detection point, the moment when enforcement is still fast, cheap, and effective.
Signal 02 — most critical
An increasing gap between the highest and lowest offers for the same SKU. A widening spread signals that sellers are no longer aligned and that one of them is about to trigger the Buy Box shift.
Signal 03
How fast the price is falling, not just how far. A slow 2% drift over two weeks is very different from a 5% drop in four hours. Velocity tells you whether repricers have activated.
Signal 04
A shift in which seller holds the featured Buy Box position. When an unauthorized or non-compliant seller wins the Buy Box, compliant sellers lose volume and the race to match their price has already begun.
Signal 05
42 Signals Platform
Real-time alerts the moment a trip wire fires. Customizable thresholds by SKU, category, or marketplace, so the right person is notified at the right moment, not a week later.
JEvery insight in this webinar is actionable. Just the framework, the signals, and the enforcement steps that stop price wars before they collapse your category.
Understand the exact sequence from the first sub-MAP listing to full category collapse so you know what you're looking for and can identify which stage you're in before it's too late.
Build a continuous monitoring setup that watches new entrants, price velocity, spread widening, and Buy Box shifts so you're always alerted at stage one, never stage four.
Understand in concrete revenue terms what a 3-day detection delay costs across a typical SKU range and use that number to make the case for real-time monitoring internally.
Detection alone isn't enough. Learn the follow-through enforcement steps like seller identification, escalation paths, and policy updates that actually stabilize pricing after a violation is caught.

Empowering clients with smart insights for a better future. Get eCommerce insights on promotions, product stocks, and market trends. 42Signals equips consumer brands with rich data to turn customer insights into retail excellence.
COMPANY
RESOURCES
NEWSLETTER

We at 42Signals are committed to GDPR compliance and the secure handling of your data. We guarantee that your information is never shared with external parties and is never stored or processed beyond its necessary purpose.

• THIS WEEK ON YOUR SHELF
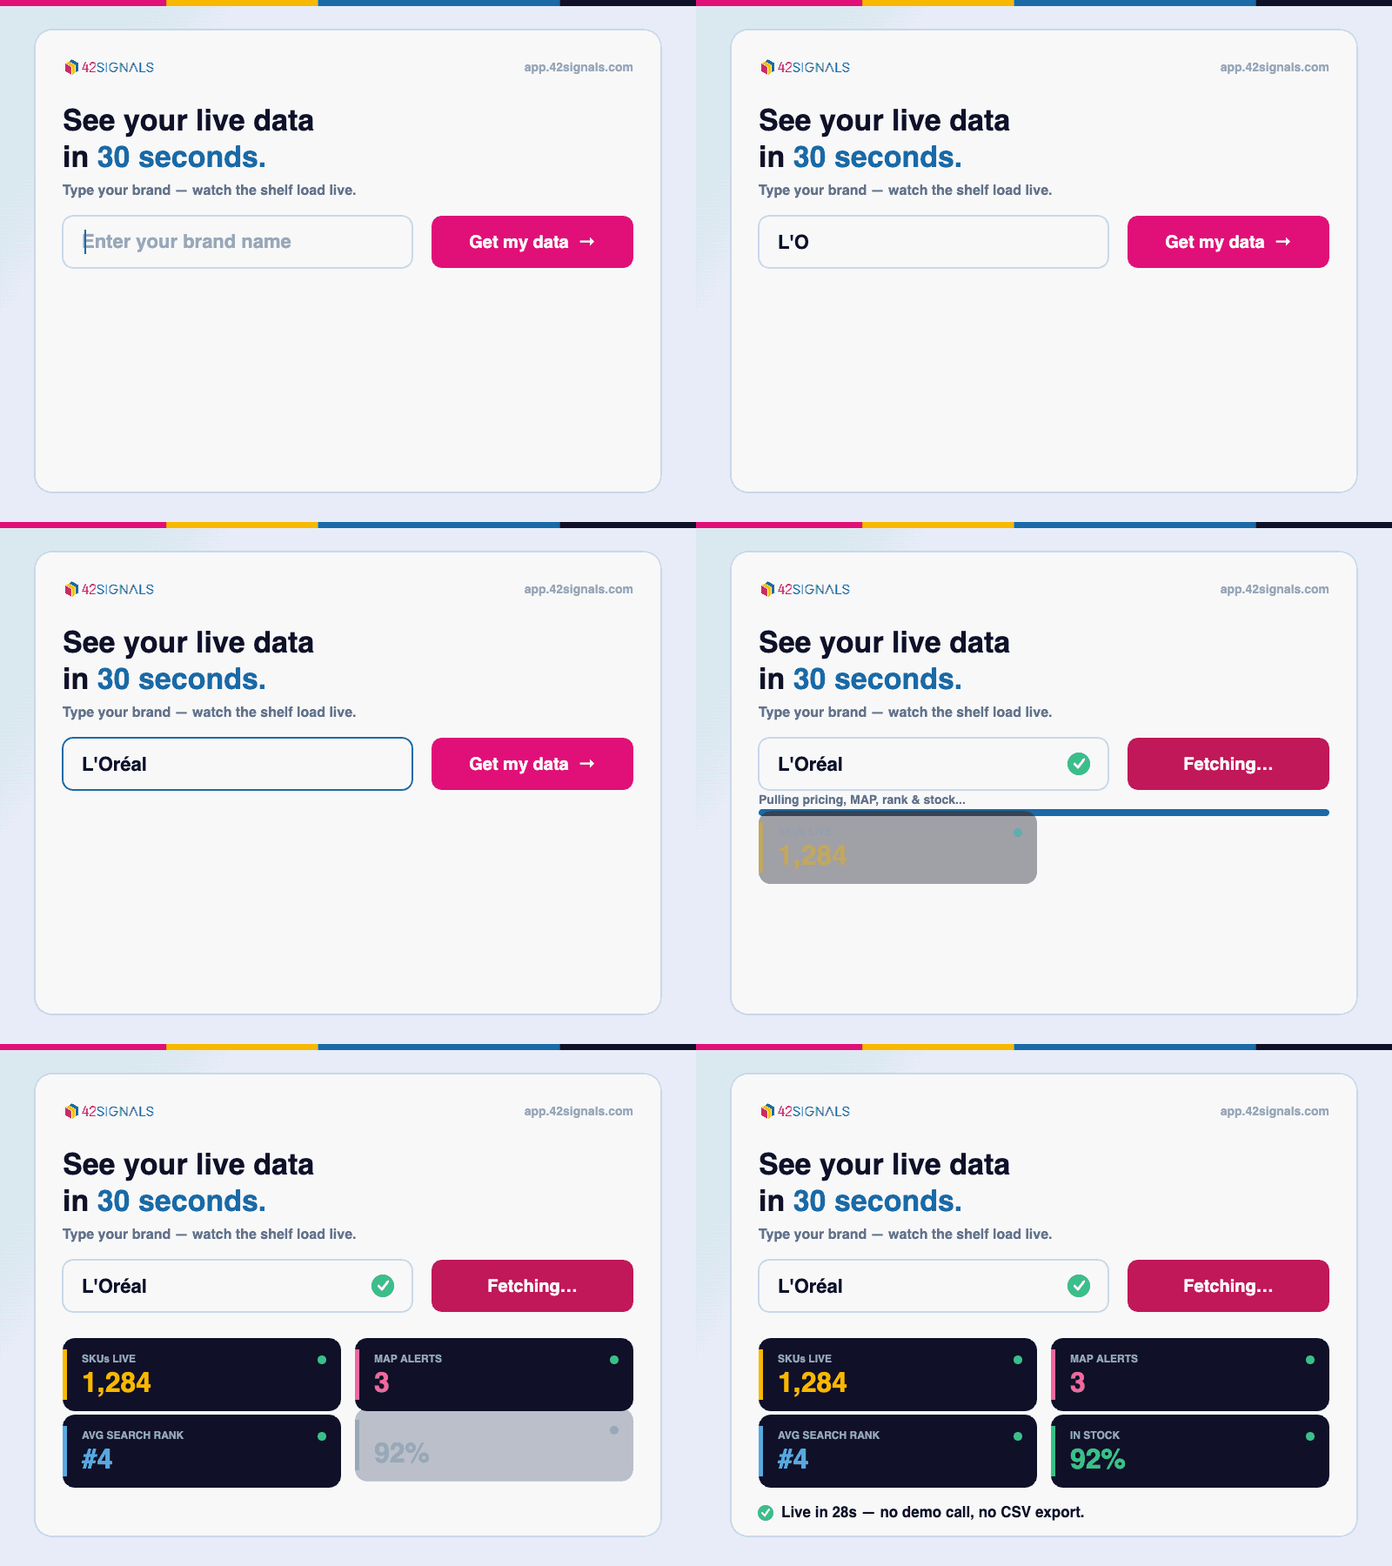
Unlock near real time digital shelf data, map violation, and competitor moves. Create your free account below.
🛡️ Free Instant Access • No Credit Card Needed
www.42signals.com
200+ Brands • 18M+ SKUs • 20+ Retailers • 4 Continents
www.42signals.com