In today’s highly competitive digital marketplace, having strong product visibility is crucial for businesses looking to succeed. With consumers increasingly turning to online shopping, optimizing the digital shelf presence of products is essential. One way to achieve this is by leveraging digital shelf data.
Understanding the Digital Shelf
The “digital shelf” is the modern battleground for consumer attention and sales. It’s the virtual space across online marketplaces (Amazon, Walmart.com, eBay, Target.com), retailer websites, social commerce platforms (Instagram Shops, TikTok Shop), and price comparison engines where your products are displayed, discovered, evaluated, and purchased. Digital Shelf Data is the rich tapestry of information generated across these touchpoints, encompassing far more than just product listings.
It’s the lifeblood of ecommerce intelligence, offering unprecedented insights into performance, competition, and consumer behavior. Understanding and harnessing this data isn’t just beneficial; it’s critical for survival and growth.
Beyond the Listing: The Multifaceted Nature of Digital Shelf Data
Digital shelf data extends far beyond static product details. It’s a dynamic, real-time stream of information:
- Product Presence & Content Completeness:
- Listing Existence: Is your product even listed on key platforms? Are all relevant variants (colors, sizes) present?
- Content Richness & Accuracy: Product titles, descriptions (short and long), bullet points, specifications, imagery (main image, lifestyle shots, infographics, videos), A+ Content/Enhanced Brand Content (EBC), size charts, manuals. Is it complete, compelling, accurate, and optimized?
- Categorization: Is the product placed in the correct, most relevant category and subcategories? Incorrect categorization kills visibility.
- Pricing & Promotions:
- Advertised Price: The price displayed on the shelf (subject to MAP policies, as previously discussed).
- Selling Price: The final price at checkout (can differ from the advertised price due to coupons, cart discounts).
- Promotional Flags: Is the product tagged as “Sale,” “Deal of the Day,” “Prime Exclusive,” “Limited Time Offer,” etc.? What specific promotions (e.g., “Buy One Get One 30% Off”) are applied?
- Shipping Costs & Speed: Free shipping thresholds, delivery time promises (Prime, 2-day, etc.).
- Availability & Fulfillment:
- Stock Status: Is the product “In Stock,” “Low Stock,” “Out of Stock,” “Backordered,” or “Temporarily Unavailable”? Fluctuations significantly impact visibility (e.g., Amazon’s algorithm demotes out-of-stock items) and conversion.
- Fulfillment Method: Fulfilled by Merchant (FBM), Fulfilled by Amazon/Walmart (FBA/FBW), Dropshipped? Buy Box ownership often hinges on fulfillment reliability.
- Buy Box Ownership: On marketplaces like Amazon, who is winning the coveted “Buy Box” for your product? This is crucial as the vast majority of sales go through this box.
- Discoverability & Search Performance:
- Search Rank: The position of your product listing for specific, relevant keywords within a marketplace’s search results (SERP) and category browsing pages. This is the cornerstone of visibility.
- Share of Search (SoS): How often your brand’s products appear in search results for key category terms compared to competitors.
- Keyword Gap Analysis: Which relevant keywords are competitors ranking for that you are not?
- Impression Share: The percentage of times your product is shown in search results when a relevant query is made.
- Customer Sentiment & Social Proof:
- Ratings: The average star rating (e.g., 4.2 out of 5).
- Reviews: The quantity and quality of written customer reviews. Sentiment analysis of review text.
- Question & Answer (Q&A) Activity: Volume and response rates to customer questions.
- Social Mentions & Engagement: How is the product discussed and shared on social media platforms (often linked from the shelf)?
- Competitive Intelligence:
- Competitor Pricing: Real-time tracking of competitor prices for identical or similar items.
- Competitor Content: Analysis of competitor listings’ titles, descriptions, images, and videos. What are they doing better?
- Competitor Promotions & Placement: Tracking competitor deals, badges, and search ranking positions.
- Competitor Reviews & Ratings: Benchmarking sentiment and volume against rivals.
Importance of Digital Shelf Analysis

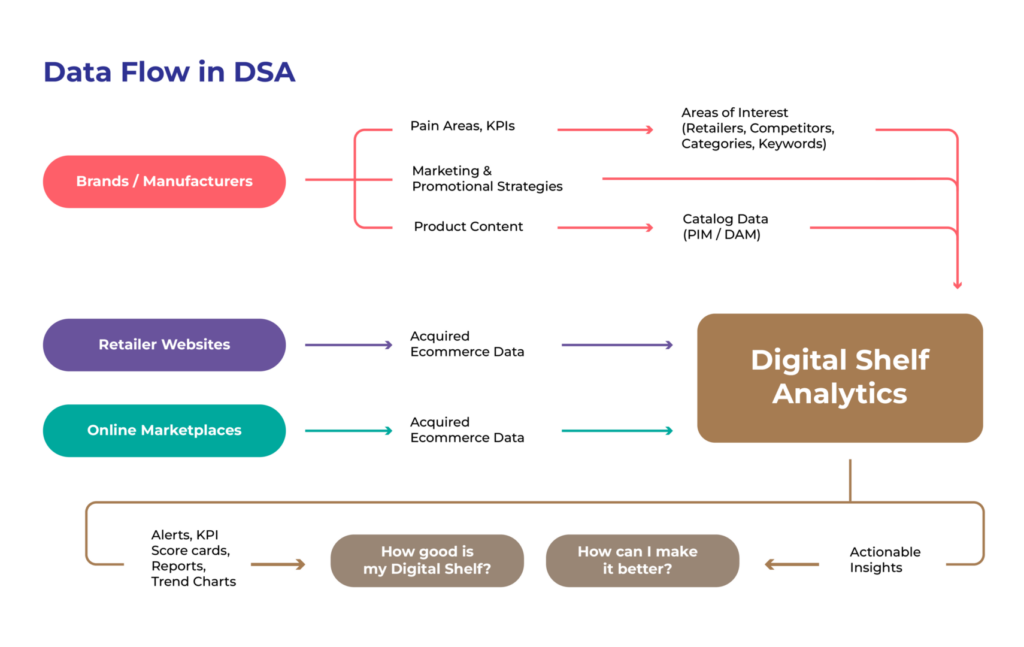
Image Source: Dataweave
Digital Shelf Analytics (DSA) transforms this raw data into actionable intelligence. Its importance is multifaceted:
Maximizing Visibility & Discoverability: Understanding why products rank where they do (keywords, content, price, availability, reviews) allows for targeted optimization to climb search results and category pages.
Driving Conversion & Sales: Optimizing content (compelling images, persuasive copy, clear value props), ensuring competitive pricing and promotions, and building strong social proof (reviews) directly impact the likelihood of a click turning into a purchase.
Protecting Brand Equity & Consistency: Ensuring product information is accurate, complete, and consistent across all retailers maintains brand image and prevents customer confusion or mistrust. Monitoring unauthorized sellers is part of this.
Optimizing Assortment & Inventory: Identifying which products perform well (or poorly) where, informing inventory allocation, new product introductions, and discontinuations. Real-time stock alerts prevent lost sales.
Understanding Consumer Preferences & Trends: Analyzing search terms, reviews, and Q&A reveals unmet needs, product issues, feature requests, and emerging trends directly from the voice of the customer.
Benchmarking Against Competitors: Gaining a clear view of competitor pricing strategies, content effectiveness, promotional activity, and customer sentiment allows for informed counter-strategies.
Improving Operational Efficiency: Identifying content gaps, stockouts, or MAP violations quickly enables faster resolution by relevant teams (marketing, sales, supply chain).
Informing Marketing & Advertising Spend: Understanding organic search performance helps refine paid search (PPC) strategies and budgets. Knowing where your product is strong/weak guides channel investment.
Identifying Key Metrics for Product Visibility

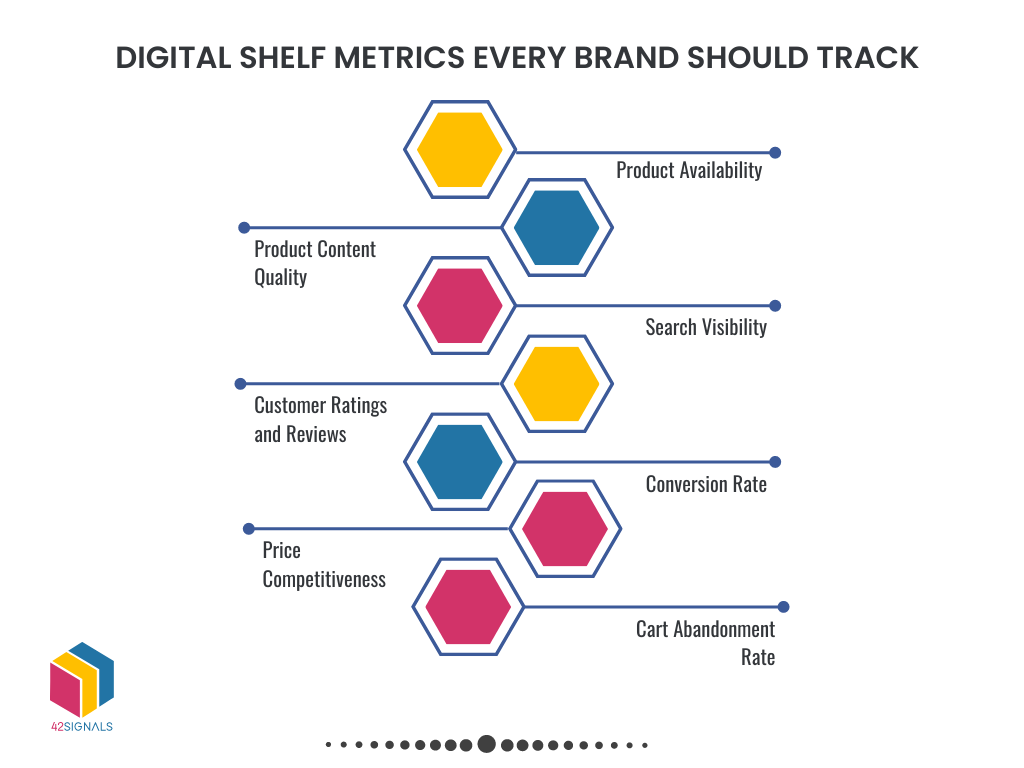
To effectively leverage digital shelf data, focus on these critical visibility metrics:
Search Rank Position (SERP Rank):
Why it Matters: The #1 organic result gets the lion’s share of clicks. Ranking on page 1 is essential. Track rank for your core target keywords (branded and non-branded).
Deeper Dive: Understand that rank varies by:
Marketplace Algorithm: Amazon A9, Walmart’s algorithm, etc., all prioritize different factors (relevance, conversion rate, price, fulfillment speed).
User Location & History: Personalization impacts results.
Device Type: Mobile vs. Desktop rankings can differ.
Action: Use rank tracking tools. Identify keywords where you rank poorly and optimize content, price, and availability. Target long-tail keywords for less competition.
Click-Through Rate (CTR):
Why it Matters: Measures how enticing your listing is when seen. High CTR means your product stands out in search results or category pages.
Deeper Dive: CTR is heavily influenced by:
Position: Higher position = higher CTR.
Main Image: Must be high-quality, visually appealing, and instantly recognizable.
Price: Competitive pricing drives clicks.
Title: Clear, keyword-rich, compelling.
Ratings & Reviews: Star rating and review count provide instant social proof.
Promotional Badges: “Prime,” “Sale,” “Bestseller” badges attract attention.
Action: A/B test main images and titles. Ensure competitive pricing. Actively solicit reviews. Qualify for relevant marketplace badges.
Conversion Rate (CVR):
Why it Matters: The ultimate metric – what percentage of visitors to your product detail page (PDP) actually buy? High CVR signals your PDP is persuasive and meets expectations.
Deeper Dive: CVR is impacted by everything on the PDP:
Imagery & Video: Multiple high-res images, infographics, demonstration videos.
Copy: Compelling title, clear bullet points highlighting benefits (not just features), detailed yet scannable description.
Price & Value: Perceived value relative to price and competition.
Availability: “In Stock” is crucial. Fast shipping options.
Social Proof: Star rating, review count & quality, Q&A responses.
Trust Signals: Secure checkout badges, return policy clarity.
Buy Box Ownership: Winning the Buy Box is essential on marketplaces.
Action: Continuously optimize PDP content based on digital shelf data and best practices. Analyze competitor PDPs. Monitor reviews for conversion-killing issues.
Share of Search (SoS):
Why it Matters: Measures your brand’s overall visibility footprint for core category keywords. A higher SoS indicates greater brand dominance and discoverability.
Deeper Dive: Calculated by the percentage of search results for a set of keywords where your brand’s products appear (often top 20 results). Tracks organic visibility share.
Action: Aim to increase SoS over time through comprehensive SEO, content optimization, and product portfolio strength. Benchmark against key competitors.
Content Completeness Score:
Why it Matters: Incomplete listings (missing images, poor descriptions, no bullet points) are severely penalized by algorithms and ignored by shoppers.
Deeper Dive: Many DSA tools provide automated scoring based on marketplace best practices (e.g., number of images, video presence, bullet point count, description length).
Action: Audit listings for completeness. Prioritize fixing listings with low scores. Ensure consistency across all retailers.
Optimizing Product Descriptions and Images
Product descriptions and images play a vital role in attracting and engaging potential customers. Optimizing them based on digital shelf data analysis is crucial for improved visibility. Here are some tips for optimization:
- Keyword Research & Integration:
- Go Beyond Basics: Use marketplace search term reports (Amazon Brand Analytics), third-party keyword tools (Helium 10, Jungle Scout), and competitor analysis to identify high-volume, high-intent keywords.
- Strategic Placement: Integrate primary keywords naturally into the Title (most critical), Bullet Points, and Backend Search Terms (where applicable). Use secondary keywords in bullet points and descriptions.
- Avoid Stuffing: Prioritize readability and user experience. Keyword stuffing is penalized.
- Crafting Compelling Titles:
- Structure: Follow marketplace best practices (e.g., Amazon:
Brand + Product Line + Key Feature 1 + Key Feature 2 + Product Type + Size/Quantity/Pack Count). - Clarity & Keywords: Be descriptive, include core keywords early, and avoid unnecessary fluff. Clearly state what the product is.
- Character Limits: Adhere to platform-specific character limits.
- Structure: Follow marketplace best practices (e.g., Amazon:
- Writing Persuasive Bullet Points & Descriptions:
- Benefit-Oriented Bullets: Focus on the benefit to the customer, not just the feature. Start with the strongest benefit. Use concise, scannable language. Incorporate keywords naturally.
- Detailed Description: Expand on bullet points. Tell the product story. Address potential customer questions. Use formatting (paragraphs, bolding) for readability. Include key specifications.
- A+ Content/EBC: Leverage enhanced content modules (images, comparison charts, lifestyle shots, detailed feature breakdowns) to dramatically improve conversion. This is non-negotiable for brands.
- Mastering Product Imagery & Video:
- Main Image: Professional, high-resolution, pure white background (marketplace requirement), clearly showing the product. Must look perfect at thumbnail size.
- Lifestyle Images: Show the product in use, solving a problem, or highlighting scale. Convey emotion and context.
- Infographics: Visually explain key features, benefits, or specifications. Easy to digest.
- 360° Views & Zoom: Enhance customer confidence.
- Video: Highly impactful. Show the product in action, demonstrate features, and build trust. Short (<60 sec), engaging, high quality. Place prominently.
- Mobile Optimization: Ensure images and video look flawless on mobile devices (where most shopping starts).
- Leveraging Reviews & Q&A:
- Proactive Solicitation: Use post-purchase emails (following marketplace TOS) to request reviews. Make it easy.
- Monitor & Respond: Address negative reviews professionally and promptly to mitigate damage. Answer customer questions quickly and thoroughly – this content becomes part of your PDP.
- Analyze Feedback: Use review sentiment analysis to identify product improvements or content clarifications needed.
Leveraging Customer Reviews and Ratings
Customer reviews and ratings an important digital shelf data component, have a significant impact on product visibility and consumer trust. Incorporating them into your digital shelf strategy can be highly beneficial.

Image Source: Sendible
This is how you can make the most of customer reviews and ratings:
- Encourage Customer Reviews: Prompt satisfied customers to leave reviews by sending follow-up emails or offering incentives for feedback.
- Respond to Reviews: Address customer concerns and respond to reviews promptly to demonstrate your commitment to customer satisfaction.
- Highlight Positive Reviews: Showcase positive reviews and ratings on your product pages to build trust and enhance visibility.
- Use Ratings in Advertisements: Incorporate positive ratings and reviews in your advertising campaigns to attract potential customers.
All of this information complements digital shelf data to improve operations and customer experience.
Continuous Monitoring and Improvements
Digital shelf analysis is an ongoing process. Continuous monitoring and improvements are essential to adapt to changing market trends and consumer preferences. Some strategies for continuous improvement are:
- Regular Data Analysis: Analyze this data at regular intervals to identify trends, patterns, and areas for improvement.
- Competitor Monitoring: Keep track of competitor strategies and adjust your approach accordingly to stay ahead in the market.
- Content Optimization: Continuously optimize product descriptions, images, and other content based on insights from data analysis.
- Adapt to Customer Feedback: Listen to customer feedback and make necessary improvements to enhance product visibility and meet customer needs.
Leveraging digital shelf data provides businesses with essential insights into product performance and consumer behavior. By understanding and utilizing this data effectively, businesses can optimize product visibility, attract more customers, and drive sales in the dynamic digital landscape.
For more information on how to leverage digital shelf analytics effectively and enhance your product visibility, please reach out to us at sales@42signals.com.


