In the world of consumer packaged goods (CPG), the pace never lets up. Shelf space is limited, consumer preferences shift fast, and loyalty can disappear overnight. What gives one brand the edge while others struggle to stay afloat? Increasingly, it comes down to how effectively companies can read and respond to data, especially with CPG data insights.
Gone are the days when gut instinct or last quarter’s sales figures were enough to steer decisions. Today, success means knowing what your customer wants before they do. It means predicting demand shifts, reading digital signals, and moving inventory or campaigns in near real time.
Let’s explore how CPG companies are using smarter data insights to rethink how they sell, market, and deliver to consumers—and how even mid-sized players can gain a competitive edge.
Why CPG Data Insights Matter for ECommerce Brands
The New Rules of the Game
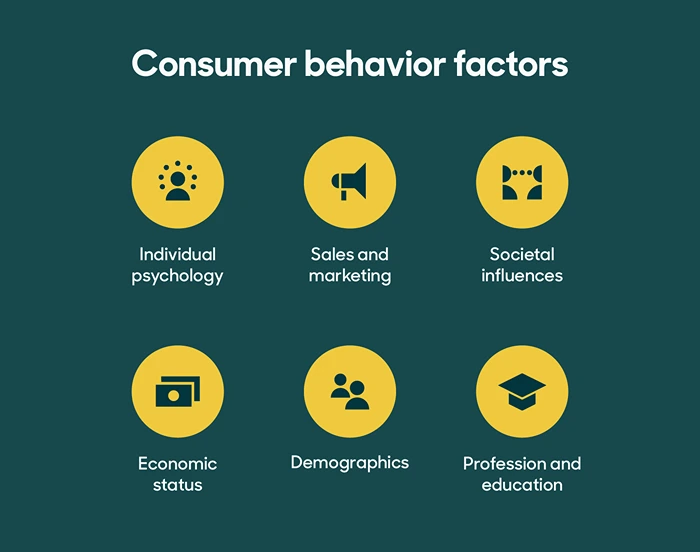
Image Source: Zendesk
Consumer behavior has changed. Shoppers no longer browse aisles without preparation. A quick search, a review on a forum, or a TikTok video now holds more sway than traditional advertising. Add that to supply chain instability and growing e-commerce influence, and the game has changed entirely.
Consider this:
- Over 75% of consumers have switched brands at least once due to product unavailability.
- Nearly 70% of buying decisions are influenced by online ratings and reviews.
- Brands that incorporate predictive analytics have seen profit margins rise by 10–15%.
What these stats reveal is a gap—a gap between traditional business cycles and the rapid-fire pace of consumer demand. Brands that close this gap with data-driven decision-making are pulling ahead.
Turning Data Into Strategy with CPG Data Insights: Core Pillars
CPG companies have access to more data than ever. But using it effectively means knowing which signals matter most and how to act on them quickly. Here are four foundational areas where data insights are transforming strategy.
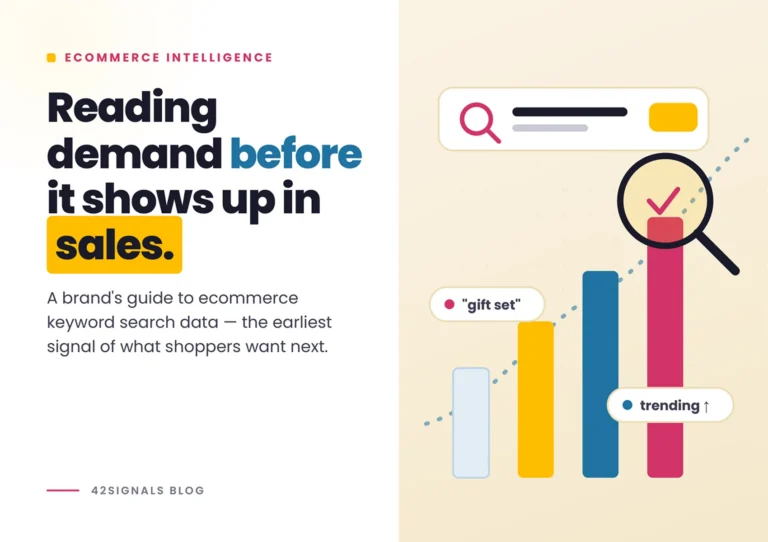
Predictive CPG Data Insights: Seeing Demand Before It Hits
Forecasting used to be a monthly or quarterly affair. Today, it’s a daily task. Predictive analytics, powered by machine learning and historical data, helps brands plan inventory, adjust production, and even tailor marketing based on what’s likely to happen next.
Practical Use Cases:
- A beverage company notices increased searches for “zero sugar energy drinks” and adjusts flavor development priorities.
- A regional bakery chain prepares for a weather-related spike in comfort food demand after analyzing past patterns.
Tools You Can Use for CPG Data Insights:
Platforms like SAP Analytics Cloud or Microsoft Azure Machine Learning help integrate predictive models with existing systems.
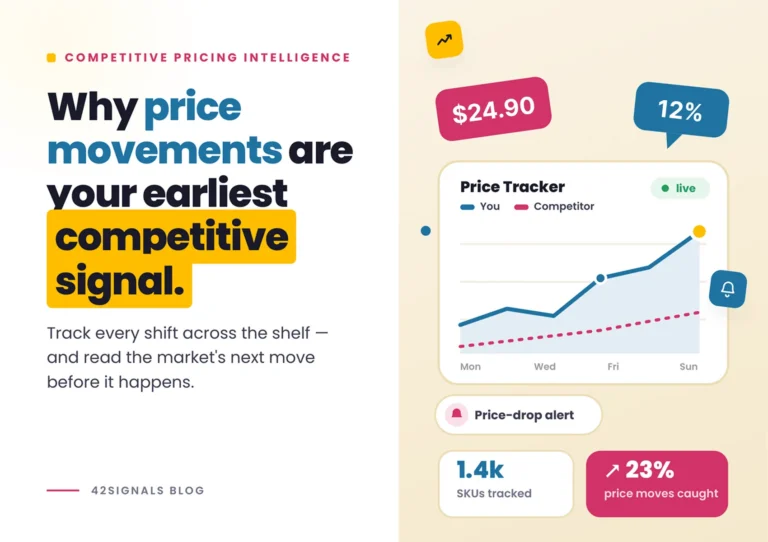
Digital Shelf Analytics: Winning the E-Commerce Race
A product might be top quality, but if it’s buried on page four of Amazon or out of stock on Walmart.com, it won’t sell. Digital shelf analytics lets brands see how their products perform in online retail environments
What to Track:
- Product visibility in search results with share of search (especially for branded vs. generic terms).
- Competitor promotions, pricing, and placements.
- Retailer-specific stock status.

Action Tip:
Use tools like 42Signals that provides CPG data insights to monitor product health across dozens of digital storefronts in real time.
Consumer Sentiment: Listening to the Right Conversations
What your audience says about you matters—and they’re saying a lot. Whether it’s a glowing review, a product complaint, or a trending meme, consumer sentiment can shape your brand image faster than any campaign.
Example:
A home cleaning brand discovered a viral video showing an unexpected use of their product. By quickly jumping on the trend with new packaging and content, they saw a 20% boost in online sales.
Tools to Try:
- Review aggregators like Yotpo and ReviewTrackers.
- Social listening tools such as Sprout Social or Brandwatch.
- Advanced consumer sentiment analysis tools like 42Signals.
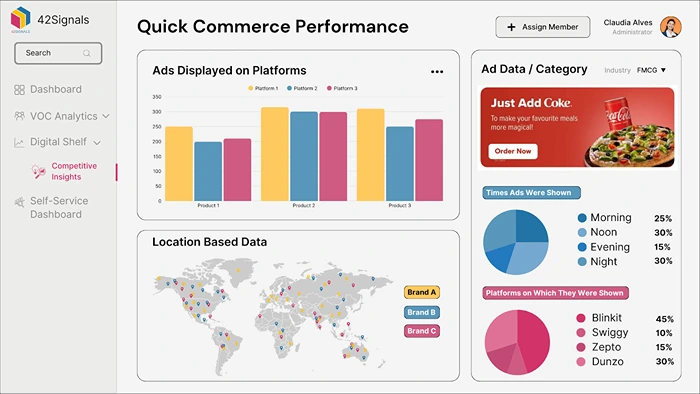
Quick Commerce and Dark Stores: Reaching the Instant Consumer with CPG Data Insights
Delivery expectations are evolving fast. With companies like Gopuff or Getir promising groceries in 15 minutes, CPG brands must adapt to these micro-fulfillment models.
What It Means:
- Smaller pack sizes and optimized packaging for rapid transport.
- Inventory forecasts tuned to fast-moving, hyperlocal trends.
Case in Point:
A popular snack brand introduced single-serving spicy chip packs targeted at quick commerce buyers in major cities. The result? A measurable 18% lift in market share in under 90 days.
Use 42Signals to track product insights on quick commerce platforms and understand performance across various interests.
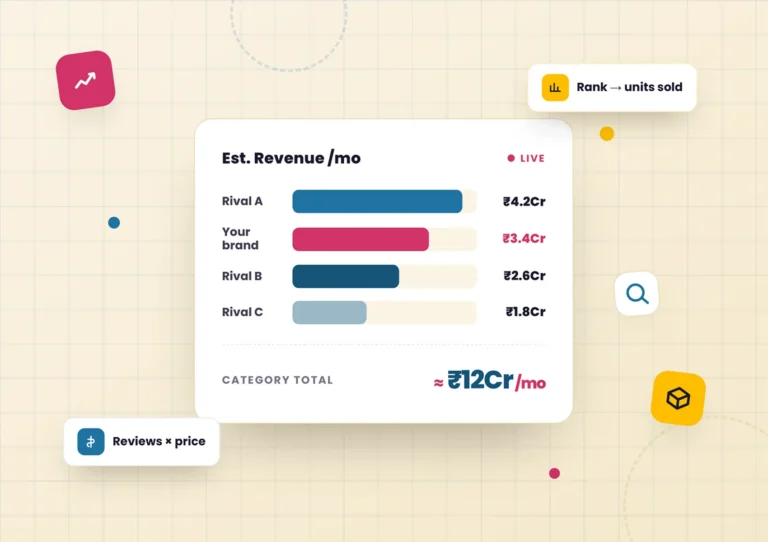
Making Competitor Data Actionable
Keeping tabs on your competitors isn’t new, but doing it in real time is. A well-built competitor analysis dashboard doesn’t just show what others are doing; it gives you the context to make better decisions, fast.
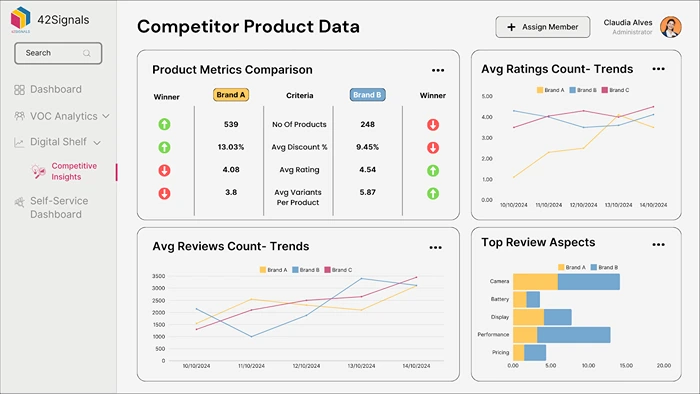
How It Helps:
- You get alerts when a rival launches a big discount.
- You can compare keyword rankings and product placements across retailers.
- You uncover long-term patterns that hint at upcoming shifts.
Smart Example:
Instead of cutting prices to match a competitor, a dog food brand added a free chew toy to its premium line—an emotional hook that preserved margins and boosted loyalty.
Five Steps to Build a Data-Centred Operation with CPG Data Insights
Moving from scattered data points to strategic, revenue-driving action takes more than just investing in the latest tools. It requires a fundamental shift in mindset and a disciplined approach to execution. For CPG brands, the goal is to create a virtuous cycle where data informs decisions, those decisions drive performance, and the resulting performance generates even more valuable data.
The following five-step framework provides a clear roadmap to transform your operation from one that merely collects data to one that is genuinely centred around it.
1. Conduct a Data Audit
Before you can act, you must know what you have. A thorough data audit is the critical first step, but it must go beyond a simple inventory. Start by listing every source of data across all departments—from your CRM and social media analytics to POS systems, inventory logs, and loyalty programs. The key is to map not only where this data lives but also how it flows (or doesn’t flow) between systems, who uses it, and for what purpose. Crucially, identify the gaps: what critical questions can you not answer with your current data?
Pay special attention to the sprawling online marketplaces where your products are sold. Data from Amazon, Walmart.com, and other e-commerce channels is often siloed from traditional retail data, creating an incomplete picture. The audit’s ultimate goal is to identify opportunities for integration, breaking down these silos to create a single, unified view of the consumer, the retailer, and the supply chain. This foundational work turns chaotic data streams into a structured, accessible resource.
2. Focus on the Few Metrics That Matter
PriIn a world of infinite data, focus is power. The temptation to track hundreds of KPIs can lead to “analysis paralysis,” where teams are overwhelmed and unable to act. Instead, prioritize a handful of metrics that directly correlate with your core business objectives. These should become the North Star for your entire organization.
- Shelf Availability (or Digital Shelf Share): This goes beyond simple in-stock rates. It measures your product’s presence and prominence both online and in-store. A product that is out-of-stock or buried on page five of search results cannot be purchased. Improving this metric directly translates to increased sales.
- Net Sentiment Score: Moving beyond basic review ratings, sentiment analysis uses AI to understand the emotions behind customer feedback. This reveals why customers love your product or, more importantly, what specific pain points (e.g., packaging, flavor, texture) are causing frustration.
- Price Elasticity: In a dynamic pricing environment, understanding how sensitive your customers are to price changes is paramount. This metric allows you to optimize pricing strategies, match discounts intelligently across platforms, and protect your brand’s margin while staying competitive.
- Repeat Purchase Rate: Acquiring a new customer is far more expensive than retaining an existing one. This KPI is the pulse of your brand’s loyalty and product-market fit. A high rate indicates a healthy, sustainable brand; a low rate signals a need to improve the customer experience or product value.oritize KPIs like:
3. Choose Flexible, Future-Ready Tools
Opt for cloud platforms that integrate easily across teams. Think Google BigQuery, Tableau, Snowflake. 42Signals is also a great all-encompassing ecommerce solution helping brands understand the full scope of their online selling presence.
Furthermore, consider specialised platforms that solve specific CPG challenges. For instance, an all-encompassing ecommerce solution like 42Signals can provide a critical layer of market intelligence, helping brands with CPG data insights to understand their full digital shelf presence, track competitor pricing, and analyze share-of-voice—all within a single interface.
The key is to avoid rigid, legacy systems that create new silos. Your tech stack should be a modular, interconnected ecosystem that can adapt to new data sources and business questions as they arise.
4. Train Teams to Interpret, Not Just Observe
Data alone is inert; its value is unlocked through human insight. Providing frontline teams in sales and marketing with dashboards is only half the battle. The real transformation happens when you train them to interpret the data and understand what actions to take. For example, a sales team should be able to look at a real-time dashboard showing a dip in shelf availability for a key retailer and immediately initiate a conversation with the buyer to rectify the issue. A marketing manager should see a spike in negative sentiment around a specific ingredient and quickly pivot their campaign messaging or feed insights back to R&D.
This step fosters a culture of data literacy and accountability. When teams are empowered with both the data and the knowledge to act on it, they move from being passive observers to proactive drivers of business outcomes.
5. Pilot, Measure, Improve
A CPG data insights-driven culture thrives on experimentation. The most significant breakthroughs often come from small, controlled tests rather than massive, risky overhauls. Adopt an agile mindset: start small, measure relentlessly, and refine your approach.
Run an A/B test on a new product bundle, tweak your Amazon SEO strategy, or pilot a dynamic pricing model in a specific region. Use the KPIs from Step 2 to rigorously track the results. A data-backed pricing adjustment or a packaging change informed by sentiment analysis can yield surprising returns. Each experiment, whether a success or failure, generates valuable learning, creating a continuous feedback loop of improvement and innovation.
Pitfalls to Watch For
Data Overload: More data does not equal better decisions. Avoid the trap of tracking everything and acting on nothing. Stay disciplined and focus on the metrics that matter.
Privacy and Ethics: In an era of increasing regulation and consumer awareness, transparent data handling is non-negotiable. Always adhere to privacy laws like GDPR and CCPA. Building consumer trust is a competitive advantage.
Speed vs. Accuracy: The pressure for real-time insights is real, but acting on flawed data is worse than acting slowly. Establish robust data governance practices to ensure your data is clean, accurate, and reliable before scaling any action.
Case Study: Turning Insight into Revenue
GreenLife Snacks, a mid-size natural foods brand, was flatlining in online sales despite strong retail presence. Their turning point was a disciplined, data-centered makeover. First, they used predictive analytics on social media and search trend data to detect a rising consumer interest in spicy flavors—a niche they hadn’t explored. Simultaneously, they used digital shelf analytics to identify and fix critical weaknesses in their Amazon listings, which improved their search rankings dramatically. Finally, they built a competitive intelligence tracker to monitor the pricing, promotions, and new product launches of 10 rival brands.
The result? Within six months, GreenLife launched a successful new line of spicy nut mixes, reduced out-of-stocks on their top-selling products by 90% by anticipating demand more accurately, and boosted overall online revenue by over 30%.
Looking Ahead: The Next Frontier of CPG Data Insights
The future of CPG data is predictive, transparent, and increasingly automated.
- AI-Driven Dynamic Pricing: AI tools are moving beyond analysis to autonomous action, adjusting product prices across platforms in real-time based on competitor moves, inventory levels, predicted demand, and even external factors like local weather events.
- Blockchain and Supply Chain Transparency: Consumers want to know the story behind their products. Blockchain technology allows brands to track a product’s journey from farm to shelf, providing verifiable proof of sustainability, ethical sourcing, and authenticity, thereby reducing fraud and building brand equity.
- Voice Shopping Optimization: As smart speakers like Alexa and Google Home change shopping habits, the battle for the “top search result” becomes paramount. Product listings will need to be optimized for conversational, long-tail keywords and provide concise, compelling information to win in a voice-first world.
By building a robust data foundation today, CPG brands can not only solve the challenges of the present but also confidently navigate the exciting opportunities of tomorrow.
Data Is the New Shelf Space
If shelf space was once the most valuable real estate in CPG, data has taken its place. Brands that learn to act on insights quickly, personalize offerings, and predict shifts will thrive.
CPG data insights are a valuable source of data in the ecommerce domain and brands that leverage it will stand to see a lot of benefit.
Try 42Signals today to see it in action for your brand.
Frequently Asked Questions
What is CPG data analytics?
CPG data analytics refers to the process of collecting, analyzing, and interpreting data related to Consumer Packaged Goods (CPG) to make better business decisions. This includes understanding consumer behavior, sales performance, pricing trends, and market dynamics across different retail channels.
Brands use CPG analytics to:
- Forecast product demand more accurately
- Optimize pricing and promotions
- Improve supply chain planning
- Strengthen retail execution and visibility
For example, a beverage company might use CPG analytics to track which flavors perform best in specific regions and then adjust distribution and campaigns accordingly.
What are CPG insights?
CPG insights are actionable findings derived from analyzing CPG data. These insights help brands understand not just what is happening in the market, but why.
Examples of CPG insights include:
- Identifying peak buying periods for certain products.
- Discovering which marketing campaigns drive the highest conversion.
- Understanding shifts in consumer preferences, like demand for sustainable packaging.
- Spotting competitors’ pricing or assortment strategies.
Unlike raw data, insights drive strategic action—such as launching new SKUs, adjusting shelf placement, or refining promotions.
What is a CPG dataset?
A CPG dataset is a structured collection of data related to products, customers, and market activities in the consumer goods space. It may include:
- Point-of-sale (POS) data from retailers
- Online sales and marketplace data
- Inventory and supply chain records
- Consumer sentiment and review data
- Pricing and promotion history
These datasets are often used in demand forecasting, pricing intelligence, marketing analytics, and product innovation.
What are the sources of CPG data?
CPG data is collected from a mix of retail, consumer, and digital channels, including:
- Retail & POS Systems – Direct sales data from physical stores and distribution points.
- E-commerce Platforms – Online sales trends, pricing shifts, and customer behavior data.
- Syndicated Data Providers – Companies like NielsenIQ or IRI that aggregate and sell market-level data.
- First-Party Brand Data – CRM, loyalty programs, and owned digital channels.
- Web & Competitive Intelligence – Market scraping tools (like 42Signals) to track pricing, assortment, and shelf presence across marketplaces.
- Consumer Feedback Sources – Reviews, ratings, and social listening platforms for sentiment analysis.
These sources together give brands a 360° view of market activity, helping them stay competitive and consumer-focused.