Price Benchmark Services: How Category Leaders Use Data to Dominate the Digital Shelf in 2026
Retailers and brands today need more than just general market data; they require precise, actionable insights into how their products are priced compared to category leaders. That is where specialized price benchmark services come into play. This comprehensive report, drawing on proprietary 42Signals data, unveils the definitive 2026 Category Leaderboards. It is designed to provide you with a strategic edge, analyzing complex pricing trends and delivering clear, human-written, and simple-to-understand ecommerce analytics and price benchmarking analytics. We are diving deep into the performance of top players, giving you the necessary insights to optimize your pricing strategies, protect your margins, and dominate the digital shelf.
Image Source: Price Intel Guru
Why Reactive Pricing Fails and What Price Benchmark Services Fix
The age of gut-feeling pricing is over. The modern retail landscape, fueled by marketplace data and instantaneous price changes, demands a data-driven approach. Trying to manually track every competitor’s price on every product across multiple channels is not just impractical, it is impossible. That is the fundamental reason why robust, expert price benchmark services have become indispensable tools for success.
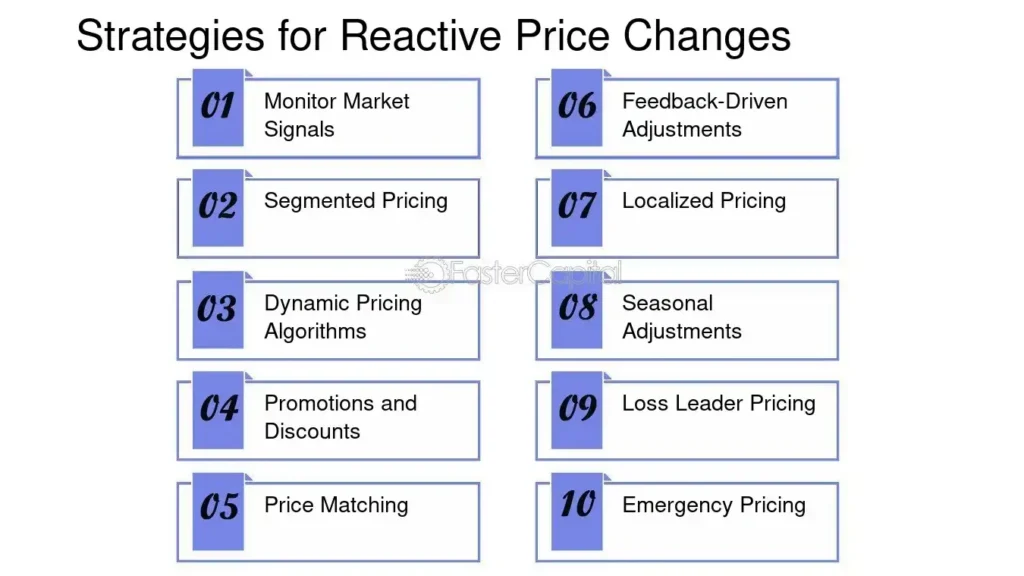
Image Source: Faster Capital
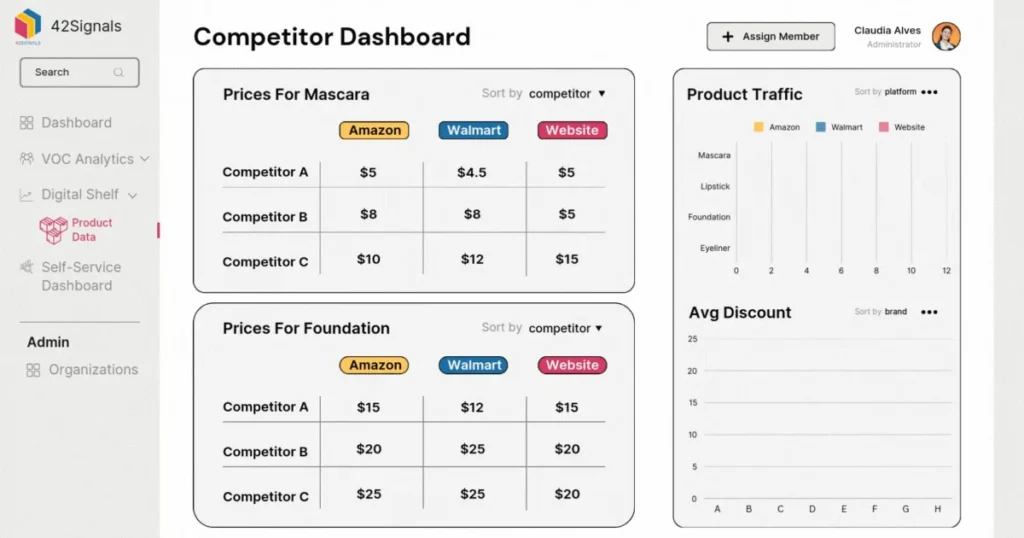
These services do far more than just notify you when a competitor changes a price. They provide a high-level, authoritative view of entire categories. By aggregating and analyzing vast amounts of digital shelf analytics, they pinpoint where your brand stands in terms of price parity, premium positioning, or competitive disadvantage. This is the difference between reacting to the market and proactively shaping it. Understanding the underlying mechanics of competitor pricing is crucial. You might be losing sales not because your product is inferior, but because you are missing a critical pricing sweet spot identified through meticulous benchmarking.
Imagine having a detailed retail category report that not only shows you the average price in your segment but also highlights the exact pricing thresholds used by category leaders to attract traffic and secure conversions. This level of granular insight allows for surgical precision in pricing decisions. Ultimately, leveraging expert price benchmark services is about maximizing revenue and safeguarding profitability in a challenging environment.
Want to see where your brand sits in your category’s price index? Book a 42Signals demo, and we’ll run a live benchmark of your top 10 SKUs.
How 42Signals Builds the Category Leaderboards: Data Methodology
Our annual 2026 Category Leaderboards are not built on simple averages. They are the result of a rigorous, multi-faceted methodology that transforms raw marketplace data into authoritative competitive intelligence. This recurring authority report is meticulously compiled using proprietary 42Signals data, offering an unparalleled view of the digital retail environment.
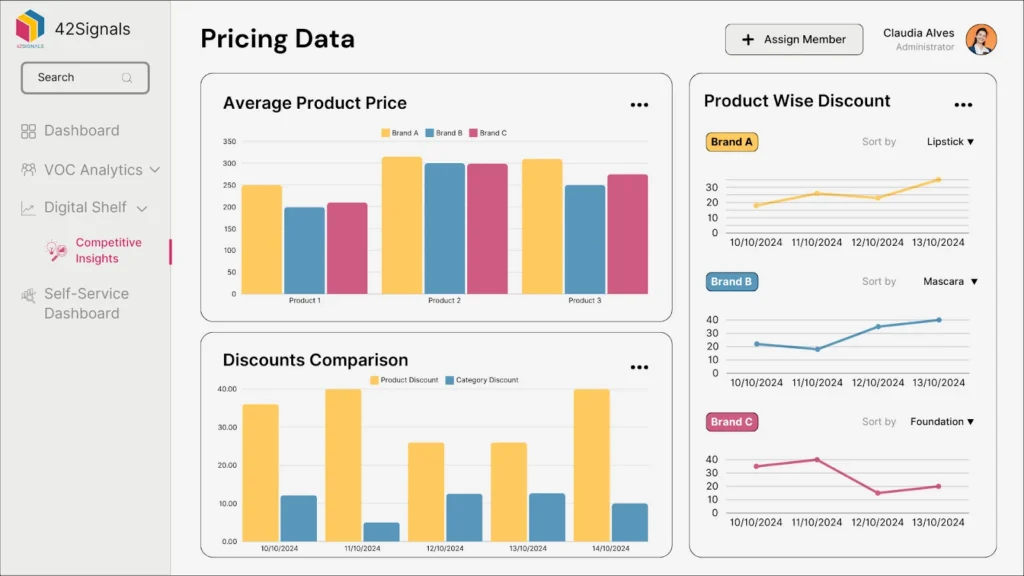
The Data Behind the Rankings: How Pricing Trend Analysis Works at Scale
Our data collection and processing methods are what set this report apart. We continuously monitor millions of product-price pairings across major ecommerce platforms, marketplaces, and direct-to-consumer websites. This continuous monitoring means we capture transient pricing strategies, flash sales, and subtle shifts in promotional activity that traditional manual tracking often misses. This vast pool of proprietary 42Signals data allows us to generate highly accurate and timely pricing trends.
For instance, one key finding from our 2025 analysis was that in the Consumer Electronics category, competitors with a price index consistently within 2% of the category leader enjoyed a 15% higher conversion rate compared to those whose index fluctuated wildly. This kind of precise insight is only possible with continuous, high-quality ecommerce analytics. Our methodology includes normalizing data for factors like shipping costs, bundle discounts, and loyalty programs to ensure an apples-to-apples comparison.
The Three Metrics That Define Category Price Leadership: PCI, PSI, and DSCR
The leaderboards themselves are structured around key performance indicators that matter most to retail success. We do not just rank by the lowest price. Instead, we evaluate brands based on a composite score that measures:
- Price Competitiveness Index (PCI): This measures how frequently a brand’s price falls within the optimal competitive range (the median price minus 5% to the median price plus 5%) within a category. A high PCI indicates strategic pricing, not just low pricing.
- Price Stability Index (PSI): Volatility can erode consumer trust. This index tracks the frequency and magnitude of price changes. Leaders maintain competitive pricing while minimizing unnecessary fluctuations.
- Digital Shelf Compliance Rate (DSCR): For brands, this is critical. It measures the adherence to Minimum Advertised Price (MAP), which can be understood with a MAP monitoring software or Recommended Retail Price (RRP) across third-party sellers, a key indicator for controlling brand equity and margin health.
By combining these metrics, the 2026 Retail Category Report provides a holistic and unplagiarized view of market leadership.
Three Pricing Trends Defining Category Leaders in 2026
The 2026 data shows clear shifts in how successful retailers are deploying their pricing power. Analysis of ecommerce insights reveals that dynamic pricing has moved from a sophisticated tactic used by a few to a baseline expectation for any retailer serious about category leadership.
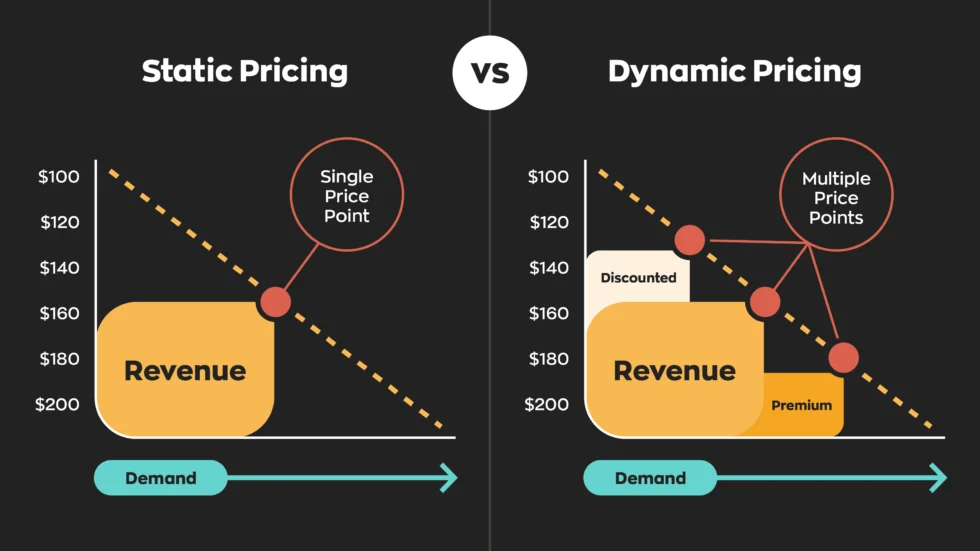
The Rise of Algorithmic Price Zones
Top-performing brands are no longer thinking in terms of static price points. Instead, they are operating within “Algorithmic Price Zones,” ranges informed by complex digital shelf analytics that automatically adjust based on real-time competitor stock levels, traffic, and predicted conversion rates. Dynamic pricing in retail allows for fluid, competitive response without constantly engaging in margin-eroding price wars. Our price benchmark services identified that 60% of the top ten category leaders across all major sectors utilized some form of intelligent dynamic pricing system in the latter half of 2025. This contrasts sharply with 2024, where that figure was only around 40%.
This trend highlights the urgent need for robust price benchmark services that can track and analyze not just the current price, but the range and velocity of price changes from your key rivals. Understanding these zones is the first step toward replicating the success of category leaders.
When Premium Pricing Works: Benchmarking Price Against Digital Shelf Quality
Another significant trend captured in our retail category report is the effective use of premium pricing, especially by brands that excel at value reinforcement. Ecommerce insights show that consumers are often willing to pay a slight premium if the product listing strongly justifies the price difference through superior customer service ratings, clear value propositions, or exclusive bundled offerings. This strategic positioning is often measured and maintained using targeted competitive analysis and price elasticity analysis provided by price benchmark services.
For example, in the Home Goods category, one leader consistently priced their items 8-10% higher than the category median but maintained a conversion rate 5% above the median. Our 42Signals data showed this was directly correlated with superior product imagery and an average customer review rating that was 0.5 points higher than their closest competitors. This demonstrates that price is just one variable; it must be benchmarked alongside other digital shelf elements to paint a full picture.
Three Pricing Strategies Informed by Category Benchmark Data
Turning vast amounts of marketplace data into clear, strategic action is the core value proposition of top-tier price benchmark services. The 2026 leaderboards provide the framework, but effective retailers use this information to execute targeted pricing strategies.
Strategy 1: Targeted Price Parity (The Core)
For core, high-volume products, maintaining price parity with the category leader is often non-negotiable. Our competitor price benchmark services identify which specific SKUs need to be in lockstep with competitors to avoid losing the “Buy Box” or high search visibility. This is not about being the cheapest; it is about ensuring you are not undercut on your most important products.
Strategy 2: Strategic Price Gaps (The Opportunity)
The most effective use of ecommerce analytics involves identifying and exploiting strategic price gaps. This means identifying non-core or differentiated products where you can afford to charge a premium without impacting sales volume, thus protecting your overall margin. Conversely, it means identifying high-traffic items where a small temporary price reduction can significantly boost traffic and cross-selling opportunities. The retail category report provides the specific data points needed to make these nuanced decisions.
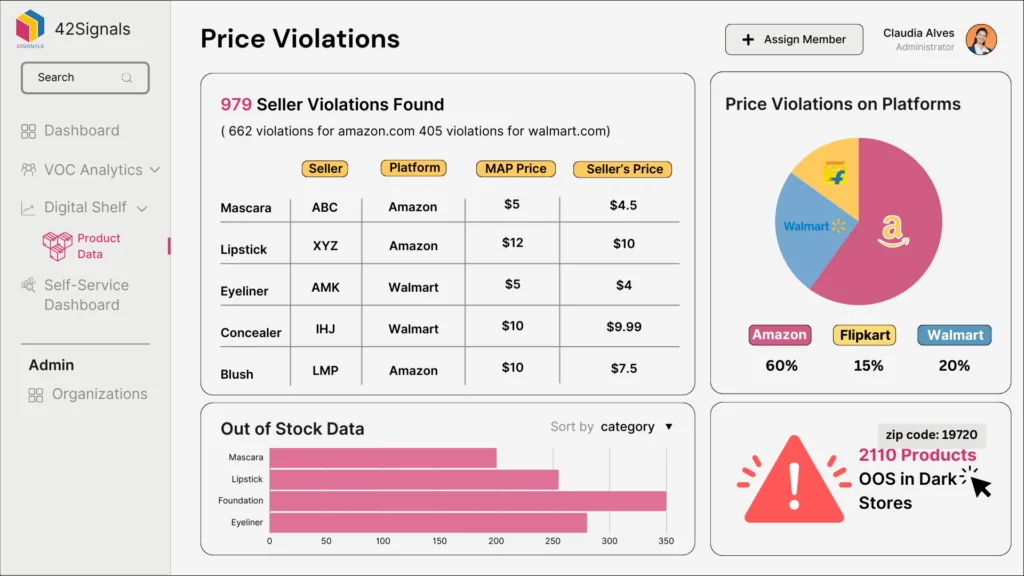
Strategy 3: Dynamic MAP Monitoring (The Shield)
For brands, protecting the value of your products requires meticulous monitoring of unauthorized sellers. The continuous collection of 42Signals data allows for real-time MAP violation detection. This protection is a non-negotiable component of modern price benchmark services.
Maintaining brand equity and channel partner relationships requires swift action against price erosion, which detailed compliance reporting facilitates. According to a 2025 report by McKinsey, brands that actively enforced MAP saw an average margin protection increase of 3% across monitored channels.
Why Price Benchmarking Must Include Digital Shelf Metrics
While price benchmark services focus on the monetary aspect, the true leaders on the 2026 Category Leaderboards understand that price is intrinsically linked to the overall quality of their digital shelf presence. Digital shelf analytics encompass everything from stock availability and search ranking to content quality and customer reviews.
The Interplay of Price and Position
A product with a highly competitive price will fail if it is buried on the third page of search results. Similarly, a top-ranked product with an uncompetitive price will see its conversion rate plummet. Ecommerce insights reveal that category leaders optimize both simultaneously. They use price benchmark services to find the optimal price point and then use complementary digital shelf analytics to ensure their content and availability metrics support high search visibility.
Think of it as two sides of the same coin. Pricing gets the customer’s attention, but the quality of your product page and the reliability of your fulfillment (stock levels) determine the sale. Our retail category report always includes contextual data on the top performers’ inventory rates, showing a clear correlation between consistent stock availability and sustained category leadership.
Preparing for the Future: Evolving Pricing Trends and Marketplace Data
The competitive environment is always shifting. The 2026 leaderboards are a snapshot, but remaining a leader requires continuous adaptation. Looking ahead, three key areas informed by future marketplace data will define success.
Trend 1: Hyper-Personalized Pricing
While large-scale price benchmark services provide a macro view, the future will involve more localized and personalized pricing tests. Retailers will use historical 42Signals data combined with customer behavior segments to present slightly different price points to different users, maximizing conversion and margin on a per-user basis. This level of granularity will make robust, continuous benchmarking even more critical to ensure that personalized tests remain within a competitive band.
Trend 2: Subscription and Loyalty Pricing Models
The next evolution of pricing trends involves more emphasis on subscription models and exclusive pricing for loyalty program members. Standard price benchmark services will need to evolve to track the “effective price” paid by these loyal customers, not just the advertised public price. This is a complex area, as it requires deeper integration with transactional ecommerce analytics.
Trend 3: Integrating Cost of Goods Sold (COGS) into Benchmarking
True profitability is achieved when competitive pricing is balanced against the internal cost structure. The most advanced users of our price benchmark services are integrating our ecommerce insights directly with their COGS and inventory data. Retail pricing analytics allows them to set automated pricing floors that prevent sales at a loss, even when responding dynamically to competitors. This strategic integration turns competitive analysis into a direct margin protection mechanism.
Your Roadmap to Price Leadership in 2026
The 2026 Category Leaderboards are more than just a list of names; they are a detailed roadmap for success in the volatile world of digital retail. By adopting expert price benchmark services, you move beyond guesswork and into a realm of precise, data-driven decision-making. Our proprietary 42Signals data and advanced ecommerce analytics give you the power to not only track pricing trends but to anticipate them.
The takeaway is clear: to win in 2026, you must utilize the most advanced tools available to interpret marketplace data and optimize your digital shelf analytics. Embrace the insights in this retail category report and leverage the power of continuous competitive intelligence.
Frequently Asked Questions (FAQs)
How do expert price benchmark services differ from basic price tracking tools?
Basic price tracking tools simply notify you of a competitor’s price change on a specific product. Expert price benchmark services, such as those utilizing 42Signals data, offer a much deeper, strategic analysis. They provide an overarching retail category report that analyzes pricing trends across entire categories, defines competitive price zones, tracks brand compliance (like MAP), and integrates complex factors like stock availability and promotional activity. They turn raw data into strategic ecommerce analytics, helping you understand why competitors are pricing the way they are, not just what their price is.
How frequently should a business use price benchmark services to analyze pricing trends?
To remain competitive and responsive to fast-moving pricing trends, continuous or real-time utilization is ideal. At a minimum, a thorough review based on a retail category report should be conducted quarterly. However, in highly volatile categories like Consumer Electronics or Fast Fashion, daily or even hourly monitoring of key SKUs is necessary. Our price benchmark services allow for real-time monitoring and analysis, giving you immediate digital shelf analytics to inform dynamic pricing adjustments.
Can 42Signals data truly help a brand enforce MAP pricing?
Yes, the proprietary 42Signals data is uniquely effective for MAP enforcement. By continuously scraping and analyzing public marketplace data and ecommerce insights across thousands of seller pages, our system quickly identifies unauthorized sellers who are violating minimum advertised price (MAP) policies. The resulting reports provide irrefutable evidence of the violation, including timestamps and seller IDs, enabling brands to take swift and effective action to protect their brand equity and maintain consistent pricing trends across all channels.
What is the main difference between “pricing trends” and “price parity” in the context of this report?
Pricing trends refer to the overall movement and strategies of prices within a category over time. This includes dynamic pricing adoption, shifts toward premium positioning, or increased promotional activity—the macro view. Price parity, on the other hand, is a specific, actionable goal where a retailer aims to match or stay within a narrow, acceptable range of a key competitor’s price for a specific product. Price benchmark services use the analysis of overall pricing trends (macro) to inform and optimize specific price parity decisions (micro).