Forecast Accuracy and Model Drift: An Overview
The key to business success is maintaining high forecast accuracy through the rigorous monitoring of advanced machine learning models. This involves continuously tracking performance using intuitive metrics like Mean Absolute Percentage Error (MAPE) and its more robust counterpart, Symmetric Mean Absolute Percentage Error (SMAPE). Crucially, organizations must implement proactive model drift monitoring—using statistical tests to detect shifts in input data or prediction distributions—to catch problems early. When drift or low accuracy is detected, a process involving diagnostic backtesting and a pre-defined retraining cadence (both time- and event-based) is essential to update the model and restore its predictive power, thereby transforming forecasting from a one-time project into a continuous, risk-mitigating operational cycle.
The Critical Role of Forecast Accuracy in Business Success
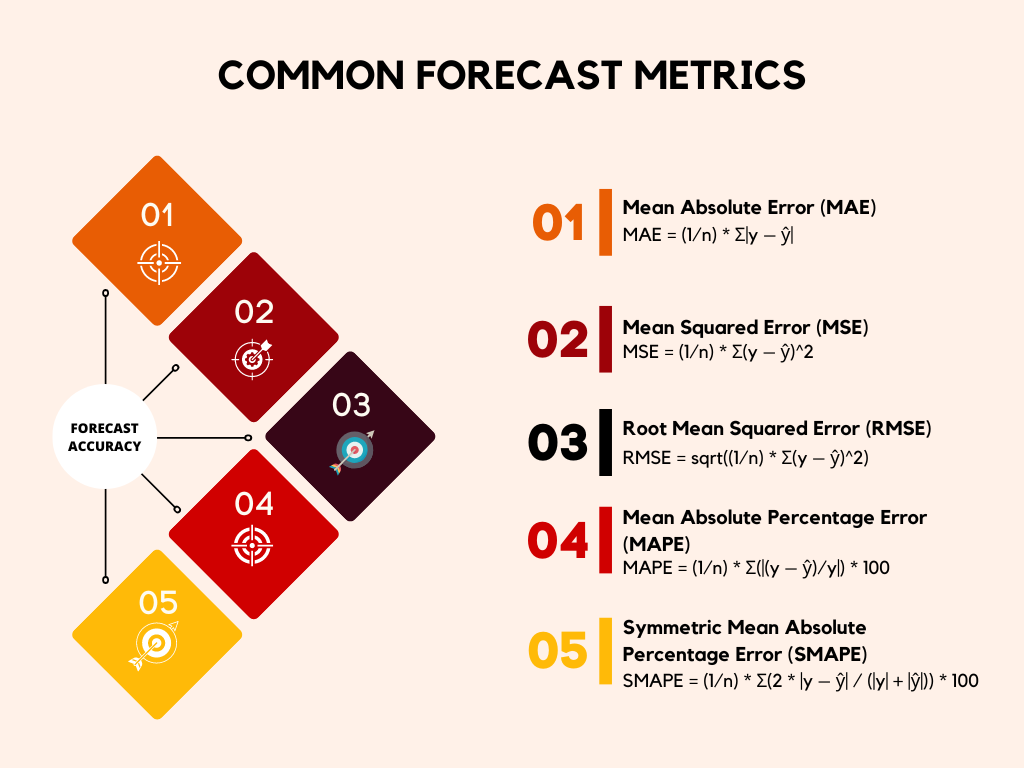
Image Source: Cash Flow Inventory
Have you ever wondered what separates the most successful businesses from the rest? Often, it comes down to their ability to look into the future, or more precisely, their capacity for accurate forecasting. Whether you are managing inventory, predicting sales, allocating resources, or planning for market changes, having a reliable estimate of what is coming next is absolutely essential. Good forecasting is the foundation upon which strategic decisions are built. If your forecasts are consistently off the mark, every subsequent decision, from hiring staff to ordering supplies, risks being flawed, leading to wasted resources and missed opportunities.
Reliance on advanced machine learning models for forecasting has become the norm. These models sift through mountains of historical data, identifying complex patterns and relationships that a human analyst might miss. But building the model is only the first step. The real challenge, and the focus of this article, is ensuring its continued reliability—what we call forecast accuracy—and detecting when its performance starts to slip, a phenomenon known as model drift monitoring.
Without robust systems for both, even the most sophisticated model can quickly become a liability rather than an asset. We are going to dive into how industry-standard metrics like Mean Absolute Percentage Error (MAPE) and Symmetric Mean Absolute Percentage Error (SMAPE) provide the necessary tools for this vital work, and how to proactively set up detection systems to maintain peak model performance.
See how mastering forecast accuracy with MAPE, SMAPE, and proactive drift monitoring helps you monitor the ecommerce KPIs that power reliable demand predictions and smarter retail decisions with the help of digital shelf analytics. Learn more about using
Why Forecasting Needs Constant Vigilance: Understanding the Error
When we talk about forecast accuracy, we are fundamentally talking about the size of the error: the difference between what your model predicted and what actually happened. No forecast is ever perfectly accurate, but the goal is to minimize that error as much as possible. Too large an error means your business is operating based on faulty assumptions.
For example, if a retail company consistently overestimates demand (a low forecast accuracy), they end up with excessive inventory, leading to holding costs and potential markdowns. Conversely, if they underestimate demand, they face stockouts, resulting in lost sales and customer frustration. The key is establishing a clear, quantifiable measure of this error that everyone in the organization can understand and act upon.
MAPE and SMAPE: Your Essential Tools for Measuring Forecast Accuracy
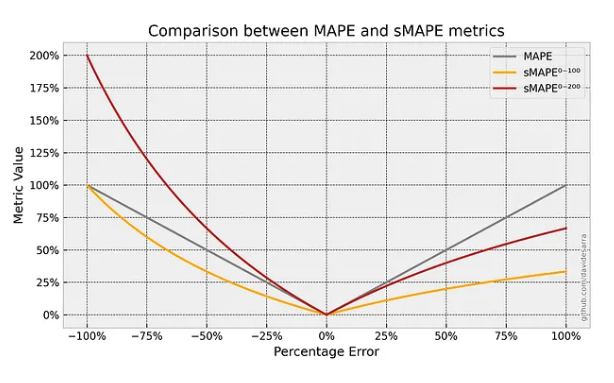
Image Source: Medium
To effectively manage and improve forecast accuracy, we need standardized metrics. While there are many ways to measure error, two of the most popular and practical for business forecasting are MAPE and SMAPE. They both offer a percentage-based view of error, which is often easier to interpret and compare across different products or business lines, regardless of their scale.
Decoding Mean Absolute Percentage Error (MAPE)
MAPE, or Mean Absolute Percentage Error, is one of the most widely used metrics for assessing forecast accuracy. It expresses the error as a percentage of the actual value. To calculate it, you find the absolute difference between the actual value and the forecast, divide that by the actual value, and then average these percentage errors over all your data points.
The primary benefit of MAPE is its intuitive nature. A MAPE of 5% means that, on average, your forecasts are off by 5%. This is a concept that is easily grasped by both data scientists and business stakeholders alike. However, it does come with a significant limitation. MAPE becomes undefined or disproportionately large when the actual value is zero or very close to zero. This happens often when forecasting demand for new or slow-moving products. In those cases, a tiny absolute error can translate to an enormous, misleading percentage error, thus skewing the overall measure of forecast accuracy.
Introducing Symmetric Mean Absolute Percentage Error (SMAPE)
Recognizing the limitations of MAPE, many organizations have adopted SMAPE, the Symmetric Mean Absolute Percentage Error. SMAPE addresses the near-zero actual value problem by normalizing the absolute error not just by the actual value, but by the average of the actual value and the forecast value. This symmetric approach ensures that the error percentage remains bounded, typically between 0% and 200%, providing a more stable and reliable measure of forecast accuracy, especially in environments where actual values can occasionally be zero or close to it.
The symmetry of SMAPE is a powerful feature. It treats over-forecasting and under-forecasting equally, giving a more balanced perspective on your model’s performance. For organizations that need a highly robust and reliable metric for comparing forecast accuracy across a diverse portfolio of items, particularly those with intermittent or volatile demand, SMAPE is often the preferred choice. Setting up an automated system to calculate both MAPE and SMAPE is the first crucial step in establishing a rigorous model monitoring program.
Setting Up Continuous Tracking for Forecast Accuracy
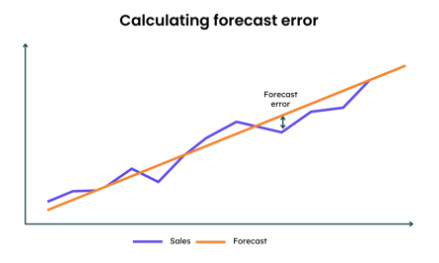
Image Source: Eazy Stock
Implementing a system to track MAPE and SMAPE is not just a technical exercise; it is a business imperative. It moves you from occasional model checks to a continuous, proactive process. The setup involves defining targets, establishing a reporting frequency, and visualizing the results.
Defining Your Accuracy Baselines and Benchmarks
Before you can monitor forecast accuracy, you must define what “good” looks like. This involves two steps:
- Establishing a Baseline: This is the current performance level of your existing forecasting method. If you are replacing a manual process or an older model, the MAPE or SMAPE achieved by that older method is your initial baseline. Your new model must consistently beat this benchmark to justify its use.
- Setting a Target: Based on business tolerance and industry standards, you need to set an achievable target. For instance, in supply chain management, a common goal for certain stable products might be a MAPE of 5% to 10%. Targets should be specific to the context; highly volatile products will naturally have a lower expected forecast accuracy than stable, established items.
It is important to remember that these baselines should not be static. As your business processes and data quality improve, your target forecast accuracy should become more ambitious.
Designing the Backtesting Strategy for Initial Validation
Before deploying any model, rigorous backtesting is necessary. Backtesting is essentially testing your model on historical data that it has not yet seen. This simulates real-world performance. You should define multiple historical testing windows, for example, the last three months, the last six months, and the last year. By calculating the MAPE and SMAPE across these various periods, you can confirm that your model is robust and not just overfitted to a specific time frame. A successful model should demonstrate consistent forecast accuracy metrics across different historical periods. This initial validation gives you the confidence to move forward and acts as the initial benchmark for your long-term model drift monitoring.
Automating Real-Time Accuracy Reporting
The most effective way to track forecast accuracy is through automated, continuous reporting. This typically involves setting up a data pipeline that runs daily or weekly, depending on your business cycle.
| Metric | Calculation Frequency | Reporting Tool | Actionable Threshold |
|---|---|---|---|
| MAPE | Daily/Weekly | Dashboard (e.g., Looker, Tableau) | Exceeds 15% for 3 consecutive periods |
| SMAPE | Daily/Weekly | Dashboard (e.g., Looker, Tableau) | Exceeds 10% for 3 consecutive periods |
The data pipeline should calculate the MAPE and SMAPE on the most recently available actual sales or demand data and compare it against the corresponding forecast made earlier. These results should be pushed to an easy-to-read dashboard, providing immediate visibility to the data science and operations teams. This continuous loop ensures that any sharp decline in forecast accuracy is noticed and flagged for investigation almost immediately, moving from reactive fire-fighting to proactive performance management.
Proactive Model Drift Monitoring: Identifying the Slippage
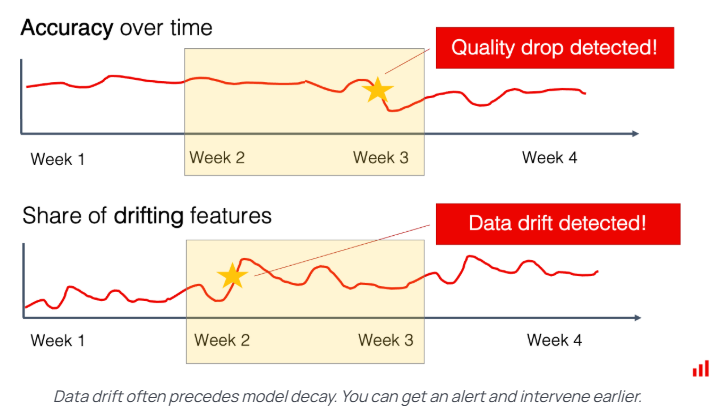
Image Source: Evidently AI
While tracking forecast accuracy tells you if your model is performing well, model drift monitoring tells you why it might be starting to fail. Model drift occurs when the relationship between the input variables and the target variable (the thing you are forecasting) changes over time. Machine learning models assume that the patterns they learned during training will hold true in the future. When real-world conditions shift—due to a new competitor, a global pandemic, a regulatory change, or even just a change in customer behavior—the model’s assumptions become outdated, and its forecast accuracy deteriorates.
What is Model Drift and Why It Matters
Model drift is insidious because it often starts subtly. Your MAPE might creep up slowly, day by day, until suddenly, your forecasts are unusable. This gradual change is much harder to spot than a sudden system failure. Effective model drift monitoring is about establishing statistical alarms that go off before the performance metrics like MAPE or SMAPE cross a critical threshold. It allows the data science team to intervene, update the model, or retrain it before the business impact becomes severe. This proactive stance is essential for maintaining a high level of forecast accuracy over the long haul.
Setting Up Statistical Detectors for Input Data Change
The most common cause of model drift monitoring needs is a change in the input data distribution—also known as data drift. Your model was trained on data with certain characteristics (e.g., average customer age, typical promotional frequency). If these characteristics change significantly in the live data feed, the model will struggle.
One key technique here is monitoring the statistical properties of your input features. For numerical features, you might track the mean and standard deviation. For categorical features, you might track the frequency of each category. Simple statistical tests, like the Kolmogorov-Smirnov (KS) test, can be automated to compare the distribution of the current incoming data against the distribution of the training data. If the KS statistic exceeds a certain threshold, it indicates a significant distribution shift, triggering an alert for potential model drift monitoring action. For instance, if you are forecasting flight demand and the average lead time for booking suddenly drops due to a new booking policy, this change in the input feature (lead time) will cause data drift, leading to lower forecast accuracy.
Monitoring Output Prediction Drift
Another critical aspect of model drift monitoring is observing the model’s predictions themselves. Sometimes the relationship between inputs and outputs changes in a way that is not immediately visible just by looking at the input features alone. This is often called concept drift.
To detect concept drift, you can monitor the distribution of the model’s output forecasts. For example, if your model was trained to predict sales that typically fall between 100 and 1,000 units, but it suddenly starts predicting values consistently below 100 or above 1,000, that is a strong signal of drift. You can apply the same statistical comparison techniques used for input data (like the KS test) to compare the distribution of recent forecasts against the distribution of forecasts the model generated during its initial, accurate period. An alarm here suggests that the underlying real-world patterns—the “concept”—that the model learned have changed, necessitating urgent intervention to restore forecast accuracy.
The Intervention Strategy: Backtesting and Retraining Cadence
Detecting a drop in forecast accuracy or an instance of model drift monitoring is only half the battle. The other half is having a clear, documented process for intervention. This intervention typically revolves around two core concepts: backtesting the model and setting a clear retraining cadence.
Utilizing Backtesting as a Diagnostic Tool
When an alarm for low forecast accuracy or model drift monitoring goes off, the first step should be rigorous diagnostic backtesting. This involves testing the existing model against a new, isolated block of recent historical data where the model is known to have failed. This is different from the initial validation. Here, you are using the backtest to pinpoint when the model started to fail and why.
For example, if your MAPE alarm triggered last week, you would re-run the model against the data from the past month. By looking at the period-by-period accuracy, you can often isolate the exact point in time when the failure began, which may correlate with a specific external event—a major holiday, a competitor’s price change, or a change in marketing spend. This diagnostic backtesting helps confirm if the drift is transient (a one-off event) or structural (a permanent change in the underlying data patterns) and informs the best course of action.
Defining Your Retraining Cadence
A model that is never updated is guaranteed to drift eventually. Therefore, a structured retraining cadence is a non-negotiable part of maintaining forecast accuracy. This cadence can be time-based or event-based.
Time-Based Retraining
This involves scheduling a full model retraining on a regular, pre-defined schedule, regardless of performance. For stable environments, a quarterly or semi-annual retraining might be sufficient. This ensures that the model is always exposed to the most recent data trends, preventing long-term stagnation. However, for highly volatile areas, such as financial markets or social media trends, the retraining cadence might need to be as frequent as weekly or even daily. The key is finding a balance between the computational cost of retraining and the business risk of low forecast accuracy.
Event-Based Retraining
This is the proactive component of model drift monitoring. When the statistical detectors we discussed earlier—the ones monitoring input data or output predictions—trigger an alert, or when the MAPE/SMAPE tracking crosses a predefined failure threshold, an immediate, off-cycle retraining is initiated. This rapid response mechanism is crucial for quickly restoring forecast accuracy after a significant, unforeseen market shift.
An effective retraining cadence policy might look like this: a mandatory full retraining every quarter (time-based) AND an automatic retraining triggered if SMAPE exceeds 15% for three consecutive weeks (event-based). This dual approach ensures both gradual refreshment and rapid response.
Beyond MAPE and SMAPE: Advanced Monitoring and Optimization
While MAPE and SMAPE are excellent high-level indicators of forecast accuracy, a comprehensive monitoring system requires looking at the errors through different lenses to truly understand the model’s behavior.
Segmenting Forecast Accuracy by Business Dimensions
An overall MAPE of 10% might seem acceptable, but it could mask a crisis in a specific, high-value segment. It is crucial to segment your forecast accuracy metrics. Instead of looking only at the overall MAPE, break it down by:
- Product Category: Is the model performing well for your staple products but failing for new launches?
- Geographic Region: Is there a regional market where the model consistently underestimates demand?
- Customer Segment: Does the model struggle with small businesses versus enterprise clients?
By segmenting the MAPE/SMAPE results, you can perform highly targeted diagnostic backtesting. A poor score in a specific category might suggest that category needs its own, specialized model, or perhaps its input data is flawed. This granularity is essential for moving from general improvement to focused optimization of forecast accuracy.
Monitoring and Interpreting Prediction Intervals
Beyond the single point forecast, advanced models can often provide a prediction interval—a range within which the actual value is expected to fall with a certain probability (e.g., 95%). A robust way to check your forecast accuracy and model calibration is to track the coverage of these prediction intervals.
Coverage is the percentage of time that the actual value falls within the predicted interval. If your 95% intervals are only capturing the actual value 70% of the time, your model is not only inaccurate but also overconfident. This overconfidence is a sign of severe model drift monitoring needs and suggests the model is underestimating the true uncertainty in the data. Monitoring coverage is a powerful, yet often overlooked, way to ensure that your forecasts provide a realistic picture of future risk.
The Human Element in Model Drift Monitoring
While automation is key, the final decision to intervene and the strategic direction for retraining belong to human experts. An alert for a drop in forecast accuracy or an instance of model drift monitoring should lead to a collaborative investigation. Data scientists need to work with business users (e.g., marketing, operations, finance) to understand the context behind the data shifts.
For example, a sudden, large dip in forecast accuracy for a specific product line might be flagged by the automated system. A human investigation reveals this coincided with a planned, but unreported, end-of-life announcement for that product, causing a sudden halt in sales. In this case, the solution is not immediate retraining; it is documenting the event and perhaps pausing the forecast for that item. The best model drift monitoring system pairs statistical rigor with human intelligence and domain expertise.
Achieving Long-Term Forecast Accuracy Through Monitoring
The pursuit of high forecast accuracy is not a one-time project; it is a continuous operational cycle. Modern machine learning models provide unprecedented power to predict the future, but they are fragile. They rely on the assumption that the world will stay the same as when they were trained. Since the world is constantly changing, a sophisticated system of checks and balances is required.
By diligently setting up tracking for MAPE and SMAPE, you establish clear, business-relevant metrics for measuring forecast accuracy. By implementing proactive statistical detectors for model drift monitoring—looking both at the input data and the output predictions—you ensure you are alerted to problems before they turn into major business losses.
Finally, by integrating diagnostic backtesting and establishing a reliable retraining cadence, you close the loop, guaranteeing your models remain sharp, relevant, and accurate over time. Businesses that master this cycle of measurement, monitoring, and intervention are the ones that truly unlock the strategic power of predictive analytics in ecommerce.
If you’re looking for reliable data to track your ecommerce performance, try 42Signals today.
Frequently Asked Questions
What is forecast accuracy?
Forecast accuracy is how closely your forecast matches what actually happened. It is not just “how far off you were,” it is whether your forecasting process is reliably close enough to make good decisions (inventory, staffing, budgets) without systematic over- or under-shooting. In practice, accuracy should be judged at the level you make decisions (SKU and location for inventory, category and week for planning, etc.) and adjusted for realities like stockouts that hide true demand.
What are the three measures of forecast accuracy?
Three commonly used measures are:
MAE (Mean Absolute Error): average of the absolute errors in the same units as the target. Useful because it is easy to interpret.
MAPE or wMAPE (Mean Absolute Percentage Error, or weighted MAPE): error as a percentage, often weighted so high-volume items matter more than low-volume ones.
Bias (Mean Error or Forecast Bias): shows whether you consistently over-forecast or under-forecast, which is often more operationally dangerous than “random” error.
How accurate is the forecast?
A forecast is “accurate” only relative to a benchmark and a decision context. You do not judge it by a single number in isolation.
A practical way to answer it:
Compare against a baseline (seasonal naive or last-period) and report improvement. If you are not beating naive consistently, your “model” is not adding value.
Check accuracy where it matters most: top SKUs, top stores, peak weeks, promo periods.
Confirm there is no strong bias (systematic over or under). A slightly higher error with low bias can be better than a lower error with heavy bias because bias creates repeatable stockouts or overstock.
How to analyse forecast accuracy?
Use a structured diagnosis instead of just reporting one metric:
Start with clean definitions
Decide the forecast horizon (next week, next month), granularity (SKU-store-week), and the “actual” measure (sales vs shipments).
Fix how you treat returns, cancellations, and stockouts. For retail, you should flag stockouts because lost sales can make a bad forecast look good.
Compute core metrics and segment them
Use MAE plus wMAPE for overall error, and compute bias to capture directional issues.
Break metrics down by product tier (A/B/C), store cluster, region, channel, and promo vs non-promo periods.
Look for patterns, not averages
Does accuracy collapse during promotions, holidays, or season starts?
Are new products or long-tail SKUs dominating the error?
Are you consistently wrong in certain regions or channels?
Separate “data problems” from “model problems”
Data problems: missing inventory, wrong lead times, price not captured, promo calendar gaps, stockouts treated as low demand.
Model problems: not accounting for seasonality, ignoring promo lift/cannibalization, not handling sudden demand shifts, excessive smoothing causing lag.
Validate operational impact
Accuracy should tie to business outcomes:
Stockout rate and fill rate (service level)
Inventory turns and markdown rate
Waste or obsolescence (for perishables)
Planning stability (how often plans change because forecasts swing)
Improve with a tight feedback loop
Add drivers only if they reduce error in the segments that matter.
Introduce exception rules (promo override, outlier handling, launch curves).
Monitor drift and re-train on a cadence aligned with how fast your market changes.