The Retail Planning Tool Your Pricing Team Has Been Missing
Effective retail planning requires knowing precisely how demand shifts in response to a price change — before you commit to a markdown. This article introduces The Retail Pricing Room, a free downloadable pricing simulator built specifically for retail and e-commerce teams. It lets you model price sensitivity, run what-if analysis across multiple discount scenarios, and identify the optimal discount depth that protects gross margin. Powered by the same logic that underpins 42Signals’ digital shelf analytics, it turns abstract pricing data into decisions your whole team can act on.
Why Retail Planning Breaks Down at the Pricing Stage
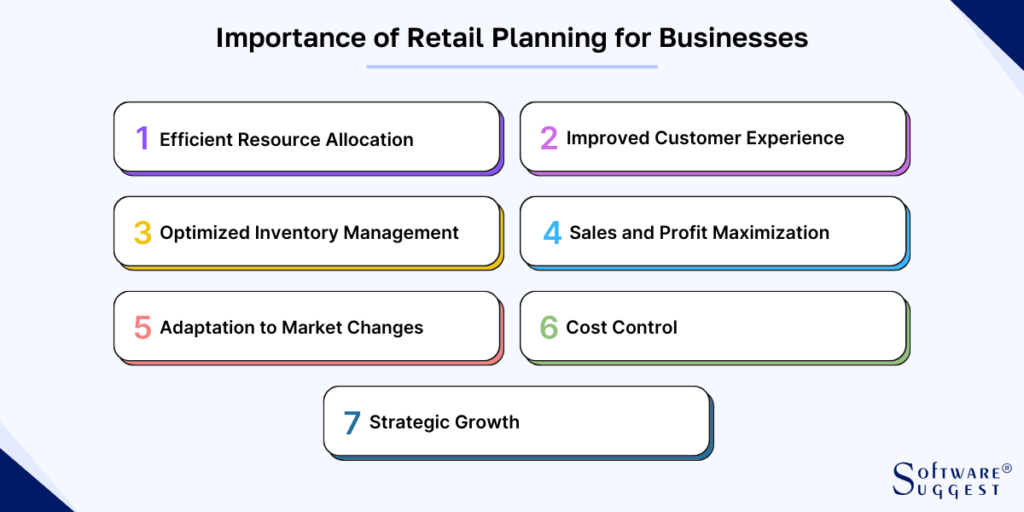
Image Source: Software Suggest
Most retail planning processes are well-organised until they reach one question: how deep should this discount be?
At that point, a surprising number of teams fall back on instinct, historical precedent, or competitive mimicry — matching whatever the category leader did last quarter. The result is a cycle of promotions that move volume but erode margin, followed by post-mortem reviews that rarely produce a better framework for next time.
The root cause is not a lack of effort. It is a lack of the right tool. Retail planning teams are typically well-equipped for demand forecasting, buy planning, and assortment decisions. But when it comes to modelling the relationship between price and demand in real time, most rely on spreadsheets built from scratch, gut feel, or neither.
This is the gap that pricing simulators are designed to fill. A proper pricing simulator sits at the intersection of pricing data, elasticity modelling, and what-if analysis — giving planners a structured way to test assumptions before they become markdowns on the shelf.
What Is a Pricing Simulator (and What It Is Not)
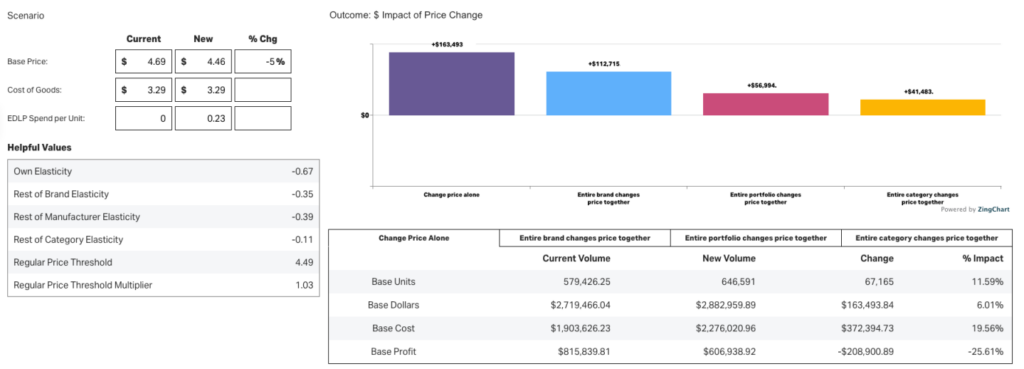
Image Source: NIQ
A pricing simulator is a structured model that calculates the expected change in sales volume, revenue, and gross profit that results from a given price change. It uses a product’s price elasticity coefficient — the ratio of percentage demand change to percentage price change — as its core input, and projects outputs across a range of discount scenarios.
What it is not is a demand forecasting system. A pricing simulator does not replace your buy plan or your inventory model. It answers a narrower, more specific question: if I move the price here, what happens to units, revenue, and margin?
Done well, this kind of what-if analysis produces three things retail planning teams genuinely need:
A demand curve for each product. Rather than a single point estimate, the simulator maps the full range of outcomes from 0% to 50% discount, showing exactly where incremental lift starts to flatten and where margin erosion accelerates.
A break-even threshold. For any given discount depth, the model calculates the minimum unit lift required to ensure the promotion generates more gross profit than a no-promo week. This is the number that separates a justified markdown from one that simply destroys value.
A scenario comparison. Instead of committing to one promotion structure, planners can stress-test five or six alternatives simultaneously — light promo, standard, deep, clearance, competitor-match — and compare the margin outcomes side by side before a single unit is moved.
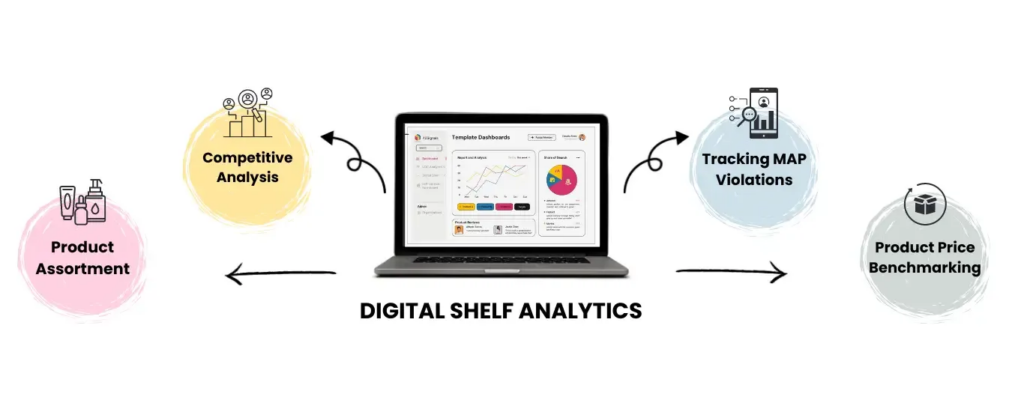
How Price Sensitivity Varies by Segment, Season, and Channel
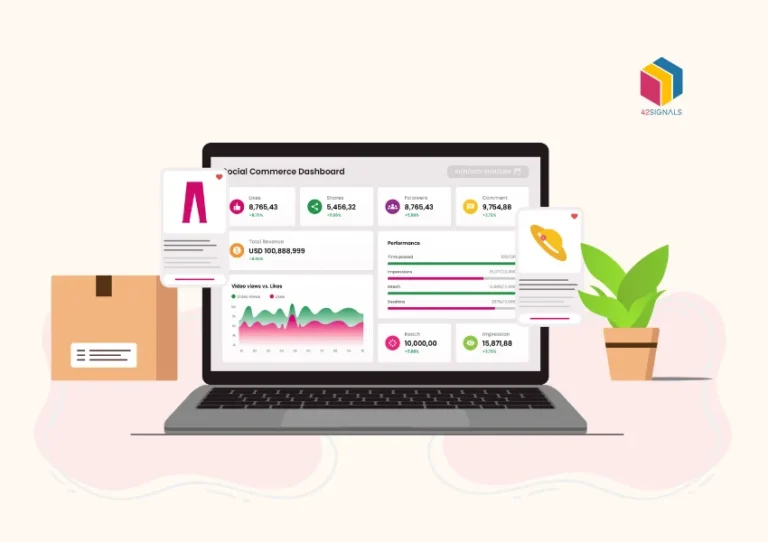
42Signals Product and Pricing Dashboard
Standard retail planning tools treat price sensitivity as a single, static number. In practice, it is neither static nor universal.
A product’s response to a 15% discount in peak season can be dramatically different from its response to the same discount in an off-peak month. A loyal buyer cohort will behave very differently from a deal-hunting segment exposed to the same markdown. And a product that faces strong competition on a marketplace will exhibit sharper price sensitivity than the same SKU sold exclusively on a brand’s own website.
This is where digital shelf analytics become essential inputs to retail planning, not just competitive intelligence. Real-time pricing data from the digital shelf — competitor price changes, in-stock signals, promotional cadence — directly affects how elastic your product appears to the market at any given moment. If a competitor drops their price by 20%, your product’s effective elasticity increases because the reference price in the category has shifted. A pricing simulator that ignores this dynamic pricing is working with stale assumptions.
The Retail Pricing strategy simulator accounts for three contextual factors that static models miss:
Seasonality index. A multiplier applied to baseline demand to reflect peak or off-peak periods. A seasonality index of 1.2 in the weeks before a major shopping event lifts the baseline from which promotional lift compounds — meaning the same discount generates proportionally more volume during peak.
Promotional halo factor. A percentage uplift applied to baseline units that captures the awareness and browsing traffic a promotion generates, even for units sold at full price in adjacent categories or on subsequent visits.
Post-promo dip factor. The flipside of promotional lift. When customers stock up during a deep discount, demand in the following period falls below baseline. A complete retail planning model accounts for this pull-forward effect rather than treating promotional lift as pure incremental gain.
How to Use the Retail Pricing Room Simulator for Retail Planning
The simulator is a structured Excel workbook built on industry-standard colour conventions: blue cells are editable inputs, black cells contain formulas, and green cells pull data from other sheets. It requires no macros and no add-ins. It opens in Excel or Google Sheets.
Sheet 1: Inputs. Enter your product’s base price, unit cost, baseline weekly units, competitor reference price, target gross margin, and elasticity coefficient. The sheet immediately calculates derived metrics — gross margin per unit, baseline weekly gross profit, price index versus competitor, and the minimum price floor derived from your margin target.
If you do not have an elasticity coefficient for your product, a reasonable starting range for reference is:
- Fast-moving consumer goods with close substitutes: −1.8 to −2.5 (highly elastic)
- Mid-range electronics or branded apparel: −1.2 to −1.8 (moderately elastic)
- Premium or niche products with low substitutability: −0.5 to −1.0 (inelastic)
For more accurate elasticity inputs derived from live market pricing data, 42Signals’ digital shelf analytics platform’s pricing analytics guide can supply category-level coefficients based on real observed price movements and sell-through signals.
Sheet 2: Scenario Simulator. Six scenarios run simultaneously. For each, enter a discount percentage. The simulator automatically calculates discounted price, demand lift, seasonality-adjusted lift, simulated weekly units, incremental units gained, gross margin per unit, weekly revenue, weekly gross profit, gross margin percentage, and the delta against your no-promo baseline. Two flags fire automatically: one if the scenario breaches your target margin, one if the discounted price falls below your COGS-derived price floor.
Sheet 3: Demand Curve. This sheet maps every discount increment from 0% to 50% in 1-percentage-point steps, plotting the resulting units, revenue, gross profit, and margin flag. It is the visual equivalent of a price-demand curve and answers the question most retail planners actually need answered: at what discount depth does gross profit peak, and how quickly does it deteriorate beyond that point?
Sheet 4: Summary Dashboard. A single-view output that surfaces the optimal discount depth (the point of maximum gross profit), the break-even lift required to justify any promotion, the estimated post-promo demand dip, and the safety stock adjustment implied by your lead time and seasonality inputs.
Reading the Demand Curve: Where Discounting Goes Wrong
The demand curve output is the most instructive sheet in the simulator, and it typically reveals one of two common retail pricing mistakes.
The first is over-discounting. This occurs when a product is relatively inelastic — customers would buy at a shallower discount — but the planning team defaults to a standard promotional depth out of habit or competitive pressure. The demand curve will show this clearly: gross profit peaks at, say, 12% and then declines as the discount deepens, even as units continue to rise. The additional volume does not offset the accelerating margin loss.
The second is under-discounting. For highly elastic products, a conservative 5% discount may generate almost no lift while still eroding margin on baseline volume. The demand curve shows that the break-even threshold is not reached until the discount is deeper, meaning a shallow promotion is the worst of both outcomes — it sacrifices margin without generating meaningful incremental volume.
Both errors are visible in the demand curve before a promotion launches. That is precisely the point of building a pricing simulator into the retail planning process.
How Digital Shelf Analytics Improves Pricing Simulator Accuracy
The simulator in its downloaded form operates on the inputs you provide. The quality of its outputs depends directly on the quality of those inputs — and the single most important input is the elasticity coefficient.
Most teams estimate this number from historical promotions, category benchmarks, or industry references. This works reasonably well for stable categories with consistent competitive dynamics. It works poorly for categories where competitor pricing shifts frequently, where new entrants have changed the reference price landscape, or where marketplace discounting by third-party sellers has altered customer expectations around what constitutes a reasonable price.
This is where digital shelf analytics provides a structural advantage in retail planning. Rather than relying on a static elasticity estimate, teams using 42Signals can observe how demand signals shift in near-real time as prices move across the competitive set — and feed more accurate, current price sensitivity inputs into their planning models.
Specifically, digital shelf analytics surfaces:
Competitor price movements at the SKU level are updated continuously, so that a competitor’s 20% discount on a directly comparable product is reflected in your planning model the same day it happens — not in the next monthly review. Pricing intelligence for retailers can help brands get the right data quickly.
In-stock and out-of-stock signals, which affect effective price sensitivity. When a competitor is out of stock, your product’s elasticity temporarily decreases because there is no readily available substitute. A pricing simulator informed by this signal would recommend a different discount depth than one working from static assumptions.
Promotional cadence patterns using price benchmarking analytics reveal how frequently competitors discount, by how much, and in which categories, enabling planners to model their own promotions in the context of the competitive calendar rather than in isolation.
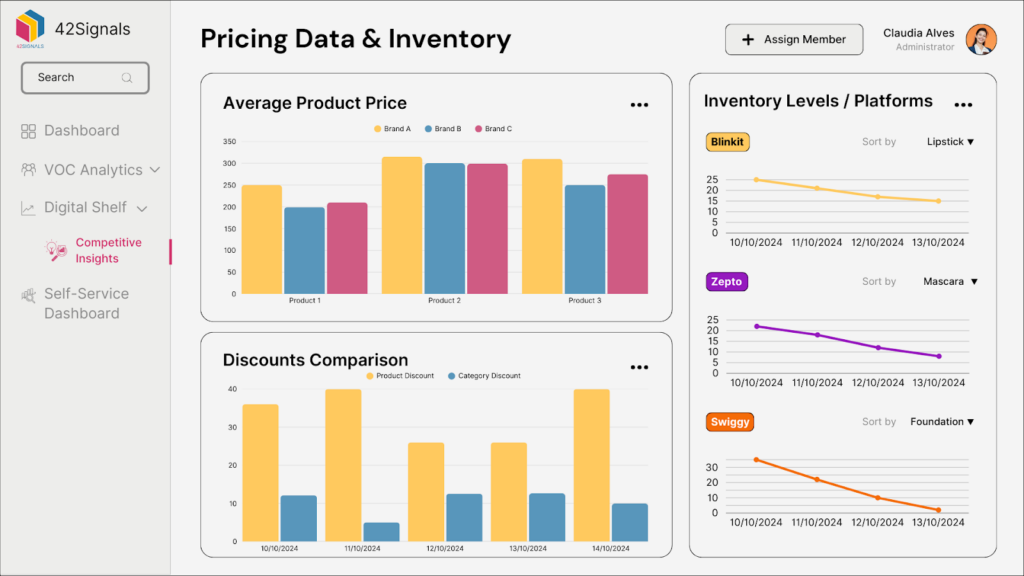
Building What-If Analysis into Your Retail Planning Process
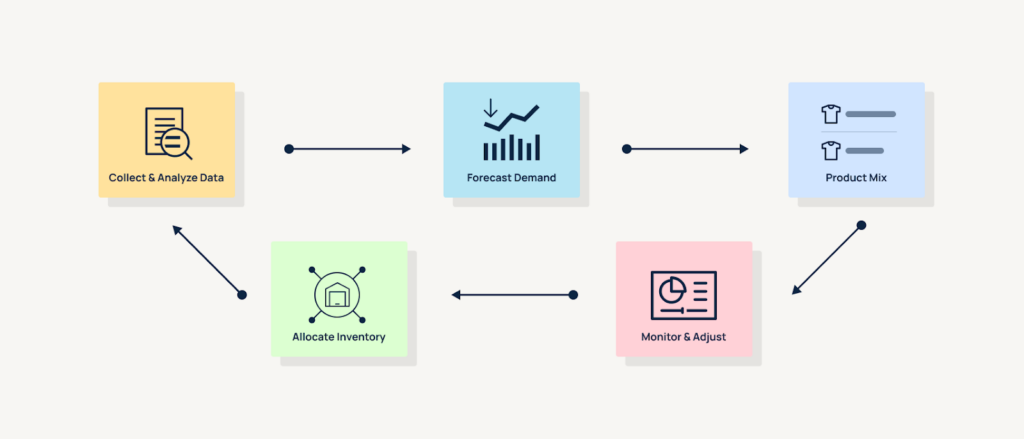
Image Source: Toolio
The Retail Pricing Room simulator is most valuable not as a one-time download but as a recurring fixture in the retail planning cycle. The practice of running structured what-if analysis for retail pricing optimization before every promotional decision builds institutional knowledge about how your specific products behave at different price points — knowledge that accumulates and improves with every promotion.
Over time, a team that systematically uses a pricing simulator will:
Develop category-specific elasticity benchmarks grounded in their own observed data, rather than generic industry estimates.
Identify which products in their range are margin-sensitive at promotional depths and should be protected from deep discounting, and which are volume-sensitive and benefit from aggressive markdowns for inventory clearance.
Build a shared vocabulary around promotional decisions — one based on margin delta, break-even lift, and optimal discount depth rather than intuition or competitive mimicry.
Spot the post-promo dip in advance and build replenishment plans that account for it, rather than treating the demand drop as an anomaly to be explained after the fact.
This is what separates reactive retail pricing from strategic retail planning. The tool is the starting point. The discipline of using it consistently is what creates the competitive advantage.
Download the Free Retail Pricing Room Simulator
The simulator is free. It requires Excel 2016 or later, or Google Sheets. No email address is required to access it.
If you want to take this further and connect your retail planning to live pricing data, competitor sell-through signals, and digital shelf analytics across your full product catalogue, book a personalised demo with 42Signals.
Frequently Asked Questions
What is retail planning in pricing?
Retail planning in pricing refers to the process of setting, evaluating, and adjusting product prices as part of a broader commercial strategy. It encompasses base price decisions, promotional pricing, markdown timing, and competitive price positioning. Effective retail planning uses pricing data and demand modelling — including tools like a pricing simulator — to ensure that price decisions are made against a clear view of their expected impact on volume, revenue, and gross profit, rather than by convention or competitor imitation.
What is a pricing simulator?
A pricing simulator is a model that calculates how changes in a product’s price are expected to affect sales volume, revenue, and profitability. It uses a price elasticity coefficient to translate a given discount percentage into a projected change in demand, then applies that demand shift to cost and margin data to show the gross profit outcome. A pricing simulator is used in retail planning to run what-if analysis before committing to a promotional markdown.
What is what-if analysis in retail pricing?
What-if analysis in retail pricing is the practice of modelling multiple pricing scenarios simultaneously to compare their expected outcomes before any action is taken. A retail team might model six scenarios — from a 5% discount to a 30% clearance markdown — and compare the resulting gross profit, margin percentage, and volume lift for each. This structured comparison replaces guesswork with data-driven decision-making and is a core discipline in modern retail planning.
How does price sensitivity affect retail planning decisions?
Price sensitivity — formally measured by the price elasticity of demand — determines how much a price change moves the needle on sales volume. Highly price-sensitive (elastic) products require a meaningful discount to drive incremental lift, but respond strongly when that threshold is crossed. Less price-sensitive (inelastic) products generate modest volume gains from discounts, meaning deep markdowns erode margin without a corresponding unit payoff. Understanding price sensitivity by product, segment, and season is the foundation of any retail planning approach that aims to optimise both volume and margin simultaneously.
How does digital shelf analytics improve retail pricing decisions?
Digital shelf analytics provides continuous, SKU-level visibility into competitor prices, in-stock status, and promotional activity across online marketplaces and retail platforms. This real-time pricing data improves retail planning decisions by supplying more accurate and current inputs to pricing models — including the elasticity estimates that drive a pricing simulator. When a competitor discounts or goes out of stock, digital shelf analytics surfaces that signal immediately, allowing planners to adjust their own pricing strategy in response rather than discovering the change in a weekly report.