How to Understand Your Brand’s Share of Visibility
Let’s think about your product’s performance on Amazon for a second. If it’s buried on page three of Amazon’s search results while competitors dominate the top spots, it means a significant amount of lost sales. For brands selling on platforms like Amazon, Flipkart, and others, understanding your share of visibility is critical to boosting sales.
But how do you measure something as intangible as “visibility”?
Let’s break down how these concepts work together to help you reclaim control of your brand’s presence online.
What Is Share of Visibility in eCommerce?

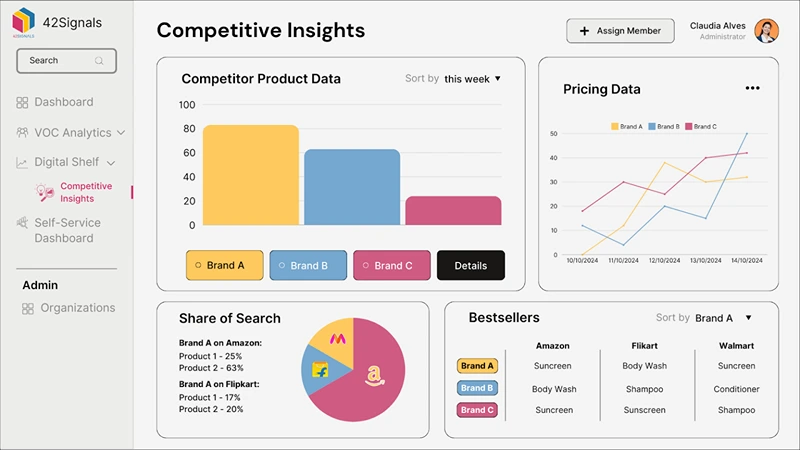
Image Source: Sprout Social
Share of visibility refers to how prominently your products are displayed across digital marketplaces compared to competitors.
It’s influenced by factors like:
- Search rankings (where your product appears for relevant keywords)
- Featured placements (sponsored ads, “Amazon’s Choice” badges)
- Click-through rates (how often shoppers click on your listing)
- Conversion rates (how many clicks turn into purchases)
It’s how much space your brand occupies. The more space it does, especially on the first page, the higher the share of visibility.
Why Share of Search Matters

Share of search is a subset of visibility. It measures how often your brand or product appears in search results for specific keywords. For example, if 70% of shoppers searching for “wireless headphones” on Amazon see your product in the top 10 results, your share of search for that keyword is 70%.
This metric is a leading indicator of market share. Brands that dominate search results often dominate sales, too.
How to Measure Share of Visibility with Digital Shelf Analytics
Tracking visibility manually across Amazon, Flipkart, and other platforms is impossible. Prices, rankings, and promotions change hourly. Competitors are also continuously changing their strategies and pricing data, that is why digital shelf analytics tools are needed.
Key Metrics to Track:
- Search Ranking Position: This is the most direct indicator of your discoverability for specific searches. Track daily:
- Core Keywords: Where do you rank for your most critical, high-volume, non-branded keywords (e.g., “bluetooth speaker,” “yoga mat non-slip”)? The top 3 positions capture the vast majority of clicks.
- Branded Keywords: Monitor your position for searches containing your brand name. Dominance here is non-negotiable, but losing ground can signal counterfeits or serious competitor attacks.
- Competitor Keywords: Track your presence (if any) when shoppers search for key competitor brands. This reveals consideration share.
- Why it Matters: Ranking directly determines whether shoppers see you on page one. Poor rankings equate to invisibility for crucial searches. Improving rankings is the most direct path to increasing your Share of Visibility in search results.
- Share of Voice: The percentage of top placements (e.g., sponsored ads, organic rankings) your brand holds.
- Definition: SoV measures the percentage of available advertising placements (primarily Sponsored Products, Sponsored Brands, Sponsored Display ads) that your brand owns for your target keywords within a given category or search result page. It’s a core indicator of your paid media dominance.
- Calculation: (Your Brand’s Ad Impressions) / (Total Ad Impressions for Target Keywords/Category) * 100.
- Why Track: High SoV means you’re aggressively capturing valuable top-of-page and within-search ad real estate, directly intercepting purchase intent. However, SoV is just one piece of the visibility puzzle. True dominance requires combining strong SoV with high organic rankings. Your ultimate goal is a commanding Share of Visibility – the total screen space you occupy (organic + paid) relative to competitors when shoppers browse categories or search.
- Competitor Pricing: How your prices compare to rivals’ listings.
- Track: Monitor the list prices, promotional prices (e.g., % off, coupons), and shipping costs of your top 3-5 direct competitors for identical or highly comparable products.
- Why Track: Algorithms factor in conversion rate. If your price is significantly higher than competitors’ visible on the same page, your click-through rate (CTR) and conversion rate (CVR) will suffer, hurting your organic ranking over time. Pricing intelligence allows for strategic adjustments (e.g., targeted promotions, bundle value) and helps identify MAP (Minimum Advertised Price) violations. Competitive pricing protects the traffic your visibility efforts generate.
- Stock Availability: Out-of-stock products vanish from search results, crushing visibility.
- Track: Real-time or near-real-time monitoring of your inventory levels across all key SKUs and sales channels. Set up instant alerts for stockouts or critically low levels.
- Why Track: An out-of-stock (OOS) product disappears. Platforms like Amazon and Flipkart drastically reduce or completely remove OOS listings from relevant search results and category browse pages. All your hard-won ranking and share of visibility evaporate instantly. Even brief stockouts can cause lasting algorithmic damage, requiring significant effort to recover lost ground. Proactive inventory management is fundamental visibility hygiene.
- Content Quality: High-resolution images, keyword-rich titles, and compelling descriptions boost click-through rates.
- Track: Quantitatively and qualitatively assess:
- Image/Video Quality: Resolution, adherence to platform specs, use of lifestyle/infographic/video.
- Title & Bullet Keyword Relevance & Clarity: Are high-value keywords present naturally? Is the USP clear?
- Description & A+ Content Effectiveness: Does it tell a compelling story, overcome objections, and differentiate?
- Review Quantity & Rating: While not direct “content,” reviews massively influence perceived quality and conversion.
- Click-Through Rate (CTR): How often does your listing get clicked when shown? Low CTR signals poor content or pricing.
- Conversion Rate (CVR): How many clicks turn into sales? The ultimate test of content effectiveness.
- Why Track: Superior content directly boosts CTR (improving organic rank) and CVR (signaling product relevance to algorithms, further boosting rank). High-quality content also increases the likelihood of winning organic “Top” placement badges (like Amazon’s #1 Best Seller) and makes your paid ads (SoV) more effective. It transforms visibility into sales.
- Track: Quantitatively and qualitatively assess:
Tools like 42Signals or SEMrush aggregate this data in real time, alerting you to drops in rankings, unauthorized discounts, or stock shortages.
How Competitive Benchmarking Helps You Learn from Rivals
Competitive benchmarking involves analyzing competitors’ strategies to identify gaps in your own. For example:
- Which keywords are they ranking for that you’re missing?
- How do their product titles and images compare to yours?
- Are they running promotions you could counter?
A skincare brand noticed a competitor’s product consistently appeared in “best moisturizer for dry skin” searches on Amazon. By reverse-engineering the competitor’s title (which included exact match keywords) and improving their own content, they climbed from page three to page one in two weeks.
Competitor Analysis: Turn Insights into Action
Competitor analysis goes deeper than benchmarking. It’s about understanding why competitors succeed and applying those lessons.

Start by:
- Identifying Top Competitors: Use tools like 42Signals to find rivals dominating your category.
- Analyzing Their Listings: Look for patterns in their titles (e.g., “organic,” “premium”), bullet points, and images.
- Tracking Their Promotions: Are they running lightning deals or coupons during peak hours?
- Monitoring Reviews: Negative reviews on competitors’ products highlight opportunities to differentiate.
For instance, an electronics brand discovered a rival’s product had low ratings due to poor battery life. They emphasized their product’s “48-hour battery” in titles and ads, stealing market share within a month.
4 Steps to Improve Your Brand’s Share of Visibility
1. Audit Your Product Listings
- Optimize Titles Strategically: Go beyond basic descriptors. Research high-volume, high-intent keywords using platform tools (like Amazon Brand Analytics) or third-party software (e.g., Helium 10, Jungle Scout). Integrate primary keywords naturally (e.g., “Premium Wireless Headphones with Active Noise Cancellation (ANC) – 40H Battery”). Balance keyword richness with readability for both shoppers and algorithms.
- Elevate Your Imagery: Move beyond sterile white-background shots. Invest in high-resolution lifestyle imagery that showcases your product in action, solving a problem, or evoking a desired feeling. Include multiple angles, close-ups of key features, and ideally, infographics highlighting benefits. Video content (especially demonstrating use) significantly boosts engagement and conversion rates. Remember, compelling visuals directly impact your share of visibility within search results and category browsing.
- Maximize Enhanced Content: On platforms like Amazon, A+ Content (or Premium A+ Content) is non-negotiable for brand-registered sellers. This is your prime real estate below the fold. Use it to tell your brand story, differentiate from competitors, elaborate on complex features, showcase multiple use cases, and include high-quality comparison charts. Studies consistently show A+ Content can increase conversion rates by 10% or more by reducing purchase hesitation and building trust. On other platforms, utilize all available rich media modules.
2. Monitor Share of Visibility Regularly
Visibility isn’t static; it’s a dynamic battlefield. What worked yesterday might not work tomorrow.
- Understand Share of Search (SoS): Closely related to visibility, SoS measures how often your products appear in relevant search results compared to competitors. A declining SoS is an early warning sign that your overall visibility is under threat and requires tactical adjustments.
- Track Keyword Rankings Religiously: Set up automated daily tracking for your core branded keywords, essential generic keywords, and competitor brand terms. Use dedicated rank tracking tools (e.g., Sellics, MerchantWords) for accuracy and historical data. A sudden drop in ranking for a critical keyword is a red flag requiring immediate investigation.
- Decipher the Signals: A ranking drop could stem from multiple factors: a competitor launching an aggressive promotion or new ad campaign, negative reviews impacting your algorithm score, an unexpected algorithm update by the platform, or even changes in your own inventory levels or pricing. Daily monitoring allows you to pinpoint the cause quickly.
3. Run Strategic Promotions
Well-timed promotions are rocket fuel for visibility, pushing your products higher in organic rankings and attracting deal-seeking shoppers
- Beyond Simple Discounts: While percentage-off deals work, consider more impactful tactics:
- Value-Adding Bundles: Combine complementary products (e.g., a phone case + screen protector, a blender + smoothie cups). This increases average order value (AOV) and makes your listing stand out.
- Limited-Time Offers (LTOs): Create genuine scarcity and urgency with flash sales or short-duration discounts. Promote these heavily.
- Loyalty Programs & Exclusive Deals: Reward repeat customers with early access or special pricing, fostering retention and driving traffic.
- Leverage Platform Tools: Utilize Lightning Deals (Amazon), Supercoins discounts (Flipkart), or platform-specific coupon programs. These often feature in dedicated deal sections and email blasts, significantly amplifying visibility.
- Measure the Ripple Effect: Track not just the direct sales from the promotion, but also the halo effect. As seen with the kitchenware brand’s “Buy One, Get One 50% Off” holiday deal, a successful promotion often leads to a sustained boost in organic search ranking and overall share of visibility long after the promotion ends, as the increased sales velocity signals popularity to the algorithm.
4. Partner with Share of Visibility Platforms Proactively
Don’t operate in a silo. Platform account managers and brand partnership teams have tools and programs designed to amplify successful brands.
- Explore Exclusive Launches & Programs: As hinted with the apparel brand example, negotiating an exclusive launch (e.g., available only on Prime for 30 days, or a Flipkart First Exclusive) can be transformative. Platforms heavily promote exclusives through dedicated landing pages, email marketing, and push notifications, generating immense pre-launch buzz and securing prime visibility real estate. These partnerships often come with co-marketing support, further extending your reach.
- Build Relationships: Regularly engage with your platform account manager. Share your brand goals, new product launches, and marketing calendars. Understand the resources and programs they offer (e.g., Amazon Vine for reviews, Brand Referral Bonus, Sponsored Brands video).
- Negotiate Featured Placements: Proactively pitch for inclusion in high-visibility sections: homepage banners, category carousels, “Deal of the Day,” or themed campaigns (e.g., “Back to School,” “Festive Season”). These placements offer massive exposure beyond standard search results.
Case Study: How EcoGadgets Doubled Visibility on Flipkart
EcoGadgets, a sustainable home goods brand, struggled with low visibility for their bamboo utensil set on Flipkart. Despite strong reviews, their product lingered on page four of search results.
The Fix:
- Keyword Optimization: They added “eco-friendly bamboo cutlery set” to the title, a high-volume phrase they’d overlooked.
- Competitor Analysis: Noticed top-ranked products used video demonstrations. They added a 30-second video showing the utensils in use.
- Alert System: Used digital shelf analytics to track stock levels and avoid outages during peak sales.
Within six weeks, EcoGadgets’ product jumped to page one, increasing sales by 140%.
Tools to Automate Visibility Tracking
Manual tracking is unsustainable. Here are three tools to streamline the process:
- 42Signals: Tracks real-time rankings, pricing, and stock across Amazon, Flipkart, and more.
- Helium 10: Offers keyword tracking and competitor analysis for Amazon sellers.
- DataWeave: Provides competitive benchmarking insights for broader eCommerce analytics.
Final Thoughts
In eCommerce, visibility is a battleground. Brands that leverage share of search, digital shelf analytics, and competitor analysis gain an edge, while those relying on guesswork fall behind. Start by auditing your listings, invest in the right tools, and treat visibility as a daily priority—not a one-time fix.
Ready to Take Control of Your Visibility?
Submit your requirements to see how 42Signals can help you track rankings, monitor competitors, and dominate search results on Amazon, Flipkart, and beyond.

Explore More Guides:
MAP Violations: How to Protect Your Brand’s Pricing
The Ultimate Guide to eCommerce Competitor Analysis
Why Quick Commerce Platforms Like Blinkit Are Reshaping Retail