** TL;DR ** The 2025-2026 e-commerce landscape is defined by the “Barbell Effect,” where the moderate discount is obsolete, forcing brands to commit fully to either full-price exclusivity (building brand equity) or aggressive, deep-discount liquidation (driving cash flow), with the middle tier becoming a “dead zone.” Key trends include the strategic use of marketplaces as either “Volume Flood” or “Exclusive Scarcity” channels; Beauty’s role as a stable, high-margin category facing impending saturation; and the transformation of search into an expensive “Share of Search” war, demanding high investment in both paid ads and deep organic catalog health. To succeed, brands must audit their distribution mix, embrace a binary pricing strategy, and prioritize long-term price integrity over short-term volume velocity.
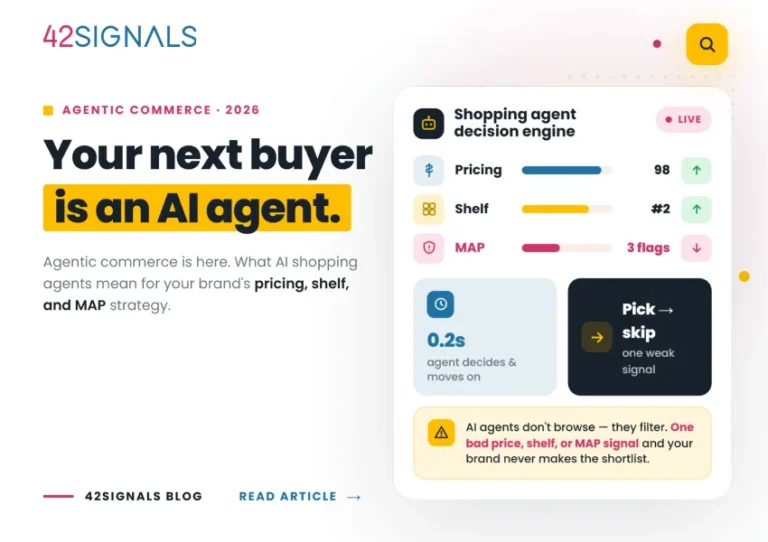
Welcome to the future of shopping. If you’ve been in the e-commerce space over the past few years, you know that “unpredictable” has been the understatement of the century. But as we step into 2026, the dust is finally settling, giving way to a landscape that is less about chaos and more about cold, hard strategy. Based on the deep-dive data from 42Signals’ Future Intelligence Unit, which analyzed over 9.8 million price signals from Q4 2024 through Q4 2025, we’re moving from market correction to clear-cut prediction. Here’s your ecommerce trends report to know the pulse of the market.
The core message? The middle ground is gone. The market has moved into a state of “calculated polarization,” demanding that retailers and brands commit fully to one of two opposing strategies. This shift is what we call the “Barbell Effect,” and understanding it is the key to mastering the upcoming ecommerce trends and unlocking profitable growth in 2026.
Mastering the Barbell Economy with ECommerce Trends
Image Source: Amio
The most significant signal coming out of 2025 is the death of the moderate discount. Remember the days of the ubiquitous “20% off everything” sale? Those modest promotions are becoming relics of a bygone era.

Our digital shelf analytics confirm that the modern consumer has been conditioned to expect one of two things: full-price exclusivity or extreme, deep-discount value. Anything in between is a “dead zone” of consumer indifference.
Why the Mid-Market Discount Died
The Barbell Effect describes a bi-modal inventory distribution: a heavy concentration of inventory at the Full Price end and an equally heavy concentration at the Clearance end (over 50% off), with a noticeable vacuum in the middle. Brands are no longer hedging their bets; they are treating merchandise with binary logic.]

Inventory is now either deemed “Brand Equity” worth protecting at full price, often under a scarcity model, or “Liability Inventory” that needs immediate, aggressive cash conversion via deep discounts. The traditional, slow, seasonal markdown cycle has vanished, replaced by AI-driven dynamic pricing that skips straight to the clearing price.
The 2026 outlook forecasts that this “Middle Tier” (the 20-50% off bracket) will shrink by another 15%, solidifying this trend. The simple fact is that the cost of warehousing and holding slow-moving, mid-tier stock is now greater than the hit taken from deep discounting. Velocity wins over margin on aged goods.
Strategic Action: Bifurcate Your Product Line
To win in this new environment, brands must create two distinct product streams.
- First, develop your “Evergreen” or “Icon” collections designed with a strict price integrity that dictates they will never go on sale. These lines build long-term brand equity and customer loyalty.
- Second, design your “Seasonal/Trend” lines with margin buffers baked in, allowing for aggressive and rapid liquidation when the trend expires.
The goal is simple: plan for a “full price or clearance” reality. Don’t waste time on a mid-season sale strategy; embrace the new Barbell reality. This is a critical ecommerce trends strategy for survival.
Platform Specialization: Your Channel is Your Signal
The days of simply “listing everywhere” and treating all marketplaces as equal sales channels are over. Our data shows a massive divergence in the strategic roles of major platforms. In 2026, brands must view marketplaces not just as places to sell, but as strategic tools that communicate a specific message about the brand’s price and positioning. This requires a level of sophistication in marketplace data analysis that goes beyond simple SKU counts.
The Divergent Strategies of Retail Giants
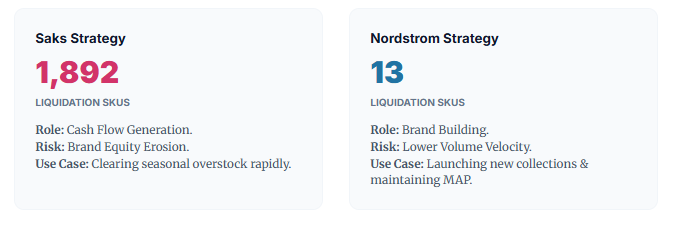
Take the extreme example of Saks Fifth Avenue and Nordstrom. Saks has clearly cemented its role as the “High-End Liquidation Engine.” Our 42Signals data showed Saks housing nearly 2,000 SKUs in the deep discount bucket (over 50% off), prioritizing volume and cash flow. It’s the destination for the transactional, deal-hunting luxury shopper. The brand’s primary role is cash flow generation, though this approach carries the risk of brand equity erosion.
Nordstrom, by contrast, has positioned its digital flagship as a fortress of price integrity. We tracked only 13 SKUs in the deep liquidation tier at their main digital property. This signals to the market that Nordstrom is the guardian of “Full Price,” with any clearance activity likely shifted entirely to an offline or separate channel (like Nordstrom Rack) to protect the main brand halo. Their role is brand building and maintaining Minimum Advertised Price (MAP), accepting lower volume velocity as a trade-off.
The Specialist’s Edge: The Shopbop Factor
Another crucial channel to watch is Shopbop, which acts as the high-velocity engine for contemporary fashion. With a discount ceiling that reaches 80%, Shopbop is the premier destination for liquidating trend-heavy “cool girl” brands quickly. For brands dealing with fast-moving fashion, using platforms like Shopbop strategically for rapid inventory exit before it completely expires will become even more critical in 2026. This move toward specialized channel allocation is one of the most defining ecommerce trends for the year.
The “Lipstick Fortress”: A Haven in Volatility
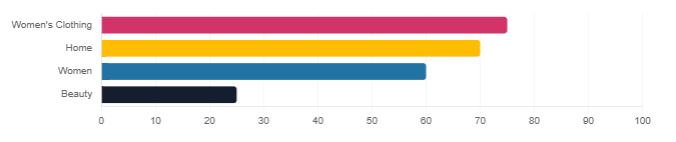
In times of economic uncertainty, capital flows to safety. In e-commerce, that safety is Beauty. The Beauty category remains the unassailable anchor for margin stability, which is a key piece of consumer insights for any retailer. While categories like Apparel and Home goods are routinely seeing discount ceilings of 75-80%, Beauty has maintained a strict ceiling of around 25%.
Why Beauty is the Margin Stabilizer
This category resilience is driven by a few factors: the product’s replenishment cycle, its generally low seasonality, and the famed “Lipstick Effect,” where consumers continue to buy small, affordable luxuries even when tightening their belts.
For multi-category retailers, the robust margins in Beauty are essential for offsetting the necessary losses taken in Apparel and other liquidation-heavy categories. It’s the balancing force on the profit and loss statement.
The 2026 Margin Pressure Forecast
Our forecast, based on this industry pulse, projects a 15% increase in lifestyle brands launching Beauty extensions in 2026, all trying to capture this stability. This influx, however, will inevitably push the discount ceiling up. We predict that the max discount in Beauty will creep up to 30% or even 35% by late 2026 as competition heats up and the market becomes saturated.
On the flip side, the Home Goods category is flashing warning signs, showing discounts near 70%. This signals a significant post-pandemic hangover, where inventory purchased during the home-improvement boom is still clogging the supply chain. 2026 will be the year for a necessary pricing “reset” in Home goods as this older inventory finally clears out of the system.
The Search Visibility War: Renting the Digital Shelf
In the crowded digital marketplace, organic reach is simply no longer enough for market dominance. Visibility is the new currency, and brands must be prepared to pay a premium to secure it.
In 2026, “Share of Search” will transition from a nice-to-have metric to the primary Key Performance Indicator (KPI) for market share growth. This is where advanced digital shelf analytics are non-negotiable.
The Cost of the Top Shelf
Our analysis of Ad Rank Distribution shows brands aggressively buying dominance. The “U.S. Polo Assn.” strategy is a masterclass in this approach, with over 3,000 appearances tracked in the Top 10 paid ad slots alone. This represents a massive investment in sponsored search placements, effectively “renting” the top shelf to crowd out competitors and capture high-intent traffic instantly. They are prioritizing immediate market presence and ensuring they are in the consideration set.
The implication for 2026 is clear: the Cost Per Click (CPC) will rise, particularly in high-demand categories like Beauty. Heavy hitters like MARS Cosmetics and Swiss Beauty are already dominating the top 10 search results. This intensifying competition means brands must significantly improve their conversion rates to justify these rising acquisition costs. Visibility without conversion is simply an expensive exercise in futility.
Winning the Generic Keyword Battleground
While branded search captures repeat customers, winning the generic keyword is how you capture new ones and grow your market share. For example, if you win “Brand Name,” you secure a loyal buyer. If you win “Cotton Tshirt,” you gain a new customer at the category entry point.
The battle for high-volume generic terms is fierce. In the “Cotton Tshirt” category, for instance, SUPERDRY is the dominant player, followed closely by U.S. POLO ASSN. and MAX. Superdry’s success here suggests high organic relevance built on strong SEO practices and effective keyword targeting.
In 2026, owning these generic “Category Entry Points” will be an invaluable component of any successful ecommerce trends strategy. Being the default choice for the core, high-volume search term is more valuable than being the best choice for a highly niche term.
The Resistance Index: The Power of Price Integrity
Success in 2026 will not just be measured by sheer sales volume, but by “Price Integrity”—the ability to maintain a high volume of inventory at Full Price (0% Discount) despite intense market pressure. The “Resistance Index,” based on 42Signals’ data, identifies the “Fortress Brands” that have successfully opted out of the race to the bottom by leveraging their brand equity, scarcity, and tight distribution control to command full price.
| Rank | Brand | Full Price SKUs | Strategy Profile |
|---|---|---|---|
| 1 | Mac Duggal | 105 | Occasion-Wear Exclusivity |
| 2 | Prada | 42 | True Luxury Scarcity |
| 3 | Gorski | 37 | Niche High-Value |
| 4 | Dress The Pop. | 32 | Event-Driven Demand |
| 5 | Norma Kamali | 31 | Cult Classic Status |
The standout example is Mac Duggal, which demonstrates that “Occasion Wear” is far less price-sensitive than daily apparel. Customers buying for a specific event, such as a wedding or gala, are simply not going to wait for a sale.
Prada’s high ranking confirms that true luxury buyers remain largely insulated from economic headwinds. These brands prove that long-term brand equity is the ultimate firewall against aggressive discounting.
Archetypes: Choosing Your 2026 Strategy

Beyond the fortress brands, contemporary labels are crystallizing into clear strategic “Archetypes.” Every brand must consciously choose their path:
- Archetype A: The Liquidator (e.g., Ramy Brook): This strategy is focused on Aggressive Cash Conversion. Brands in this category are heavily exposed to deep discounts, keeping inventory fresh and cash flow high. However, this approach risks training the customer to never purchase at full price. This is best suited for brands with trend-heavy, fast-moving inventory.
- Archetype B: The Balancer (e.g., Milly): This approach maintains a strong presence in the “Promotional Middle” (e.g., 20-50% off). The strategy uses moderate promotions to drive volume without resorting to panic-selling. While effective for maintaining volume, this is the hardest strategy to sustain as the “Barbell Economy” matures, putting immense pressure on margins.
- Archetype C: The Fortress (Based on Resistance Index): Focused on Price Integrity and Scarcity. This strategy sacrifices volume velocity for high margins and long-term brand equity.
Understanding these market signals and adopting one of these strategies wholeheartedly will be vital for navigating the complex ecommerce trends of 2026.
Channel Dynamics: The Discount Ceiling War
In 2026, the maximum discount percentage a marketplace regularly offers—its “Discount Ceiling”—is the loudest signal of its brand positioning. Marketplaces are using these ceilings to communicate to consumers whether they are a destination for “Value” or “Premiumness.”
| Marketplace | Discount Ceiling | Positioning Signal |
|---|---|---|
| Shopbop | 80% | Digital Outlet / Treasure Hunt |
| Saks | 75% | High-End Liquidation |
| Nordstrom | 71% | Premium Promotion |
| Neiman Marcus | 50% | Luxury Floor / Price Integrity |
Shopbop, with an 80% ceiling, has positioned itself as the “Digital Outlet,” attracting high-frequency browsers looking for hidden value. Brands should clearly designate this channel for end-of-season inventory clearing.
Conversely, Neiman Marcus enforces a strict “Luxury Floor” by capping discounts at 50%. This signals to the market that their inventory retains significant value, building trust with VIP clients who buy at full price, knowing the item won’t be heavily discounted the following week. These figures, derived from 42Signals marketplace data, provide a clear roadmap for channel allocation in 2026.
The Marketplace Footprint: Volume Flood vs. Exclusive Scarcity
A brand’s “Marketplace Mix”—where it chooses to distribute its products—is a direct representation of its strategic intent. The data clearly delineates two opposing distribution models that will dominate 2026:
The Volume Flood Model (e.g., U.S. POLO ASSN.): With over 68,000 products listed on mass-market platforms like Flipkart, this is a clear volume play. The focus is on maximum reach and accessibility, ensuring the brand is available to every potential customer. The priority here is market share over perceived exclusivity, a classic mass-market approach.
The Exclusive Scarcity Model (e.g., Balenciaga): With over 62,000 products on Saks Fifth Avenue and a near-zero presence on mass market platforms, this is a prestige play. The distribution is tightly gated to preserve brand equity and signal exclusivity. In 2026, high luxury brands are expected to pull back even further from open marketplaces to maintain this halo effect.
Brands must audit their current distribution matrix. Being everywhere at once is no longer a viable strategy; you must choose the model that aligns with your desired brand perception and price integrity.
Deeper Search Intelligence from ECommerce Trends: The Intent Shift
Beyond just paid ads, search volume acts as a crucial leading indicator of market intent. Our analysis of historical Share of Search (SoS) data reveals that consumer search behavior is no longer defined by traditional, sharp “Seasonal Peaks.”
The New “Always-On” Shopper
The data shows that the holiday search volume peak has shifted, largely due to procrastinating shoppers and extended shipping deadlines. However, the most crucial finding is what happened after the holiday surge. Search volume did not return to its pre-holiday baseline. January 2024 established a new, significantly higher baseline for 2025 and 2026. This “Sustained High” model means consumers are exhibiting “Always-On” search behavior. For brands, this makes year-round, “off-season” marketing and maintaining a continuous search presence absolutely critical. Ignoring non-peak months is a fatal flaw in the new ecommerce trends landscape.
Organic Rank Health: Depth vs. Top-Heavy
Organic ranking is the purest reflection of long-term SEO health and catalog relevance. We tracked where brands show up in search results—the top 10, 11-20, and so on—to see who maintains visibility as the customer scrolls deep into the product catalog.
Balenciaga’s Consistency: This luxury brand maintains a consistent “wall of inventory,” with around 23,000 results in the top 10 bucket and another 24,000 in the 11-20 bucket. This indicates a consistent, deep, and relevant catalog that ensures they dominate the visual field for luxury shoppers. Their strategy is ubiquity within their high-end niche.
The Superdry Drop-off: Superdry is very strong in the top 10 (22,000 results) but their visibility drops off significantly faster in later buckets compared to Balenciaga. This suggests an optimization heavy on best-sellers, prioritizing the top of the fold over deep catalog breadth. For 2026, brands need to consider if their strategy is top-heavy. While top-of-funnel conversion is vital, a deeper catalog may be necessary to capture long-tail search intent and maintain organic health.
2026 Strategic Forecast: Beyond the Horizon
Based on these robust consumer insights and marketplace data, 42Signals projects three definitive strategic shifts that will shape the rest of 2026:

1. The “Middle” Will Become Obsolete
The polarization of inventory will only intensify. The Barbell Economy is not a passing fad; it is the new standard operating model. The standard seasonal markdown cycle is obsolete. Brands must fully commit to either launching high-heat, exclusive items that never go on sale, or purposefully producing lines destined for deep liquidation channels. Trying to coast in the middle will result in eroded market share and inventory gridlock.
2. Beauty: Margin Pressure is Inevitable
While the Beauty category is currently a safe haven (with a 25% max discount), the overwhelming influx of brands pivoting to this resilient category will saturate the market. We predict that the discount ceilings in Beauty will inevitably creep up to 30-35% by the third quarter of 2026 as competition forces concessions. Smart brands will proactively double down on non-monetary retention strategies, such as hyper-personalized loyalty programs and exclusive access, rather than relying on margin-eroding discounts to retain customers.
3. The Rise of “Silent Sales” and Private Liquidation
To mitigate the brand damage caused by public, deep liquidation on channels like Saks Fifth Avenue, more retailers will move their heavily discounted inventory (over 50% off) into “Shadow Books.” This includes private, member-only sales, dark, unindexed website links, or “mystery box” models that hide the actual product and discount. Tracking this inventory—the true volume of product movement—will require advanced crawler technology that can pierce these private channels to get a full picture of the product movement in the market.
Final Recommendation from ECommerce Trends
The ecommerce trends of 2026 are demanding a high-stakes choice. The era of comfortable ambiguity is over. Audit your channel partners immediately. If you are a premium brand, your high exposure on liquidation-heavy platforms like Saks Fifth Avenue poses a direct, measurable risk to your long-term price integrity and brand equity.
Consider a strategic shift in inventory allocation toward protectionist platforms such as Nordstrom or Neiman Marcus, even if it means sacrificing short-term volume. Your priority must shift from simply moving product to preserving long-term shareholder value. The data from 42Signals is clear: architect your strategy now, or be defined by the market shifts.
Frequently Asked Questions
What is e-commerce data?
E-commerce data is the comprehensive body of information generated through all online commercial activities, encompassing customer behavior, product details, transactional history, and website performance. It serves as the digital footprint of an online retail business, providing crucial insights into market demand, inventory health, marketing effectiveness, and overall operational efficiency. Essentially, it is the fuel for data-driven decision-making in the digital storefront.
What is an example of e-commerce data?
An example of e-commerce data is the Customer Conversion Funnel, which tracks a user’s journey from their initial landing on a product page, through adding an item to their cart, to successfully completing a purchase. Specific data points within this example include the Cart Abandonment Rate (the percentage of users who start a checkout but do not finish) and the Average Order Value (AOV), which is the total sales revenue divided by the number of orders taken.
What are the 4 types of e-commerce?
The four primary types of e-commerce models, categorized by the parties involved in the transaction, are:
Business-to-Consumer (B2C): A company sells products or services directly to individual end-users (e.g., a shopper buying a pair of sneakers from an online brand store).
Business-to-Business (B2B): A transaction occurs between two companies, often involving wholesale or supply chain operations (e.g., a manufacturer selling bulk components to a retailer).
Consumer-to-Consumer (C2C): Individuals sell items directly to other consumers, typically facilitated by a third-party platform (e.g., selling a used book through an online marketplace).
Consumer-to-Business (C2B): An individual offers services or products to a company (e.g., a freelance graphic designer selling their design work to a small business).
How to collect e-commerce data?
E-commerce data is primarily collected through three main methods:
Web Analytics Tools: Using platforms like Google Analytics or Adobe Analytics to automatically track user behavior (page views, clicks, session duration) via tracking pixels and cookies embedded in the website code.
Internal Systems and Databases: Leveraging the company’s own back-end infrastructure (CRM and ERP systems) to record transactional data, inventory levels, order fulfillment status, and customer contact information.
Third-Party Data Sources: Acquiring external data through market research reports, competitor pricing scrapers, or survey platforms to gain broader market context and consumer sentiment.