
** TL;DR ** Clean, structured data is the essential, often-overlooked foundation for effective predictive models and advanced retail data analytics. Despite the focus on complex AI algorithms, the “Garbage In, Garbage Out” principle dictates that models trained on dirty data—incomplete, inconsistent, or inaccurate—will produce flawed forecasts, leading to costly errors like overstocking or biased decision-making. Achieving accuracy in areas like demand forecasting, dynamic pricing, and digital shelf analytics relies entirely on a robust retail data pipeline that systematically cleanses, validates, and structures data, underscoring that commitment to data quality and governance is the true competitive advantage and primary ROI driver in the age of AI.
It’s easy to get mesmerized by the flashing lights and complex algorithms of modern artificial intelligence. We talk endlessly about deep learning, neural networks, and the amazing things AI can predict, from supply chain disruptions to consumer behavior shifts. But there’s a quiet, often overlooked force that truly underpins all this magic: clean, structured data. Without this foundation, even the most sophisticated predictive models are just castles built on sand and that’s where retail data analytics comes into play.
In the fast-paced world of retail, where every decision hinges on timely and accurate forecasts, understanding the quality of your data isn’t just important—it’s existential. This article will dive deep into why clean, structured data is the true unsung hero, the essential bedrock for effective predictive models, particularly in the domain of retail data analytics.
Image Source: Oracle
The Foundation of Forecasting: Understanding Data Structure
Before we can appreciate the role of clean data, we need to understand what “structured data” actually means, especially in a retail context. Think of structured data as information organized into a fixed format, like rows and columns in a spreadsheet or a table in a database. It’s neat, predictable, and easily searchable.
In the retail environment, structured data includes crucial elements like:
- Point of Sale (POS) Records: Transaction dates, product IDs, prices, quantities sold.
- Inventory Logs: Stock levels, warehouse locations, replenishment schedules.
- Customer Profiles: Purchase history, demographics, loyalty program status.
- Website Clickstream Data: User IDs, pages viewed, time spent, and conversion events.

Image Source: Lawtomated
The opposite of this is unstructured data—think customer review text, images, or video. While incredibly valuable, unstructured data needs significant processing to be converted into a structured format before it can be effectively used by most traditional predictive models. The efficiency of your entire retail data pipeline depends on how well you manage this conversion and organization process.
The Quality Crisis: Why “Garbage In, Garbage Out” Still Rings True
It’s an old adage in data science, but it remains profoundly accurate: “Garbage In, Garbage Out” (GIGO). A model trained on flawed data will produce flawed, misleading, or outright wrong predictions. This is where the concept of data quality comes into sharp focus.
Dirty data comes in many forms, each capable of sabotaging a predictive model:
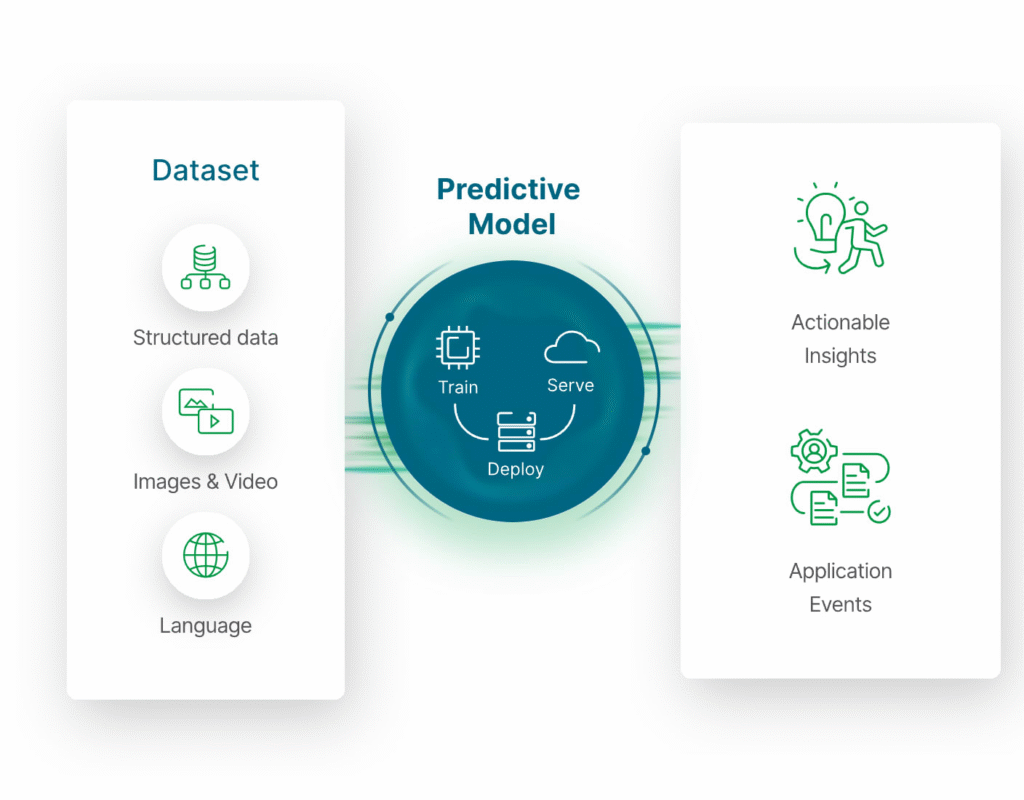
Image Source: Qlik
- Incompleteness: Missing values in critical fields. For example, a missing price point for a product will skew sales projections. When building an AI data strategy, addressing these gaps is step number one.
- Inconsistencies: The same product listed under multiple names, different date formats (e.g., DD/MM/YYYY and MM/DD/YYYY) in the same dataset, or disparate currency reporting. These small errors prevent the model from recognizing patterns accurately.
- Inaccuracies: Simply put, incorrect data. A reported inventory count that is higher or lower than the actual physical stock. If a model predicts future demand based on inaccurate historical inventory, the resulting forecast will lead to costly overstocking or understocking.
- Duplication: The same customer or transaction recorded multiple times. Duplicates inflate sales figures and distort customer lifetime value calculations.
When these issues persist, the sophisticated algorithms designed to detect subtle market trends are instead forced to spend their energy trying to correct human or system errors. This wastes computational power and, more importantly, severely degrades the reliability of the output. High-quality retail data analytics relies on proactively identifying and resolving these data quality issues.
The Role of Clean, Structured Data in Forecast Accuracy
The primary goal of predictive modeling in retail is accurate forecasting—whether it’s predicting demand for a seasonal item, anticipating staffing needs, or modeling the impact of a price change. Clean, structured data plays a direct, crucial role in achieving this accuracy.
1. Enabling Feature Engineering
Predictive models don’t just use raw data; they use features, which are measurable variables derived from the data. Clean, structured data makes the process of feature engineering—creating meaningful inputs for the model—possible and effective.
For example, a clean sales record allows you to easily engineer features like:
- Average Daily Sales Rate (ADSR): A calculation over a defined period.
- Recency, Frequency, Monetary (RFM) Score: Derived from consistent, accurate customer transaction data.
If the input data is messy, these crucial features cannot be calculated correctly, leading to a model that is essentially blind to the most predictive factors. A robust retail data pipeline ensures the consistent creation of high-quality features.
2. Reducing Noise and Bias
Data cleanliness is synonymous with noise reduction. Noise—random errors and irrelevant fluctuations—can confuse a model, causing it to overfit to the training data. A model that is overfit performs brilliantly on the data it has seen but fails spectacularly when faced with new, real-world scenarios.
Furthermore, clean data helps mitigate bias. If your historical data is systematically missing information from a certain demographic or a particular store location, the model will learn to neglect those groups, leading to biased and unfair forecasts. A rigorous AI data strategy includes auditing data for potential biases introduced by poor collection practices.
3. Improving Model Interpretability and Debugging
When a predictive model makes a bad call—say, a forecast that is wildly off—you need to know why. This is where model interpretability comes in.
When the input data is clean and clearly structured, tracing the error back to its source is relatively straightforward. You can follow the retail data pipeline from the raw data through the feature engineering process right up to the final prediction. However, if the source data is a tangled mess of inconsistent formats and missing values, debugging becomes a nearly impossible task. You’re left with a black box that spits out bad answers, and you have no way to fix it. This transparency is vital for trust and continuous improvement in any AI powered marketplace insights platform.
The Retail Data Pipeline: A System for Data Excellence
Achieving consistently clean, structured data is not a one-time task; it’s an ongoing process managed through an effective retail data pipeline. This pipeline is the technical and procedural framework that manages data flow from its source to its final use in a predictive model.
A highly effective retail data pipeline typically includes several stages designed to enforce data quality:
Ingestion and Validation
This is where data enters the system from sources like POS, ERP, or web logs. At this point, automated checks are crucial. The system should immediately validate data types (e.g., ensuring a price field only contains numbers), check for mandatory fields, and reject records that fail basic integrity tests.
Transformation and Structuring
Raw data is often semi-structured or requires combining from multiple sources. This stage transforms the data into the uniform, structured format required for analysis. This is critical for generating AI powered marketplace insights. For example, clickstream data may be transformed from individual page views into structured sessions, complete with calculated features like ‘cart abandonment rate’ or ‘time to purchase’.
Cleansing and Enrichment
This is the data scrubbing stage. It involves:
- Deduplication: Identifying and merging identical records.
- Standardization: Ensuring all entries for categories (e.g., product color, store name) use a consistent spelling and format.
- Handling Missing Data: Employing techniques like imputation (filling in missing values using statistical methods) or, if appropriate, flagging records for exclusion.
- Data Enrichment: Adding external context, such as linking store traffic data to local weather patterns, or enriching customer profiles with publicly available demographic data.
Storage and Accessibility
The final, clean, and structured data must be stored in a way that is easily accessible and queryable by data scientists and predictive models. Data warehouses or modern data lakes optimized for analytical workloads are essential here. Effective storage ensures that the most recent, highest-quality data is always used for retraining and deployment of models.
Deep Dive: How Data Quality Impacts Digital Shelf Analytics
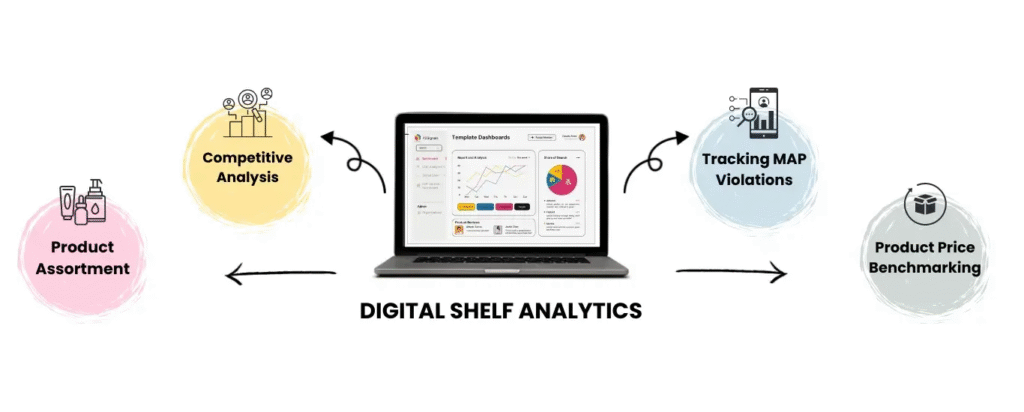
Let’s look at a concrete example within retail: digital shelf analytics. This area focuses on tracking and optimizing a retailer’s or brand’s presence across various ecommerce platforms. Predictive models here aim to forecast sales rank, product visibility, and the impact of price changes.
The data used for these insights includes:
- Product Metadata: Cleanliness is paramount. If the product title, category, or description is inconsistent across marketplaces, the model cannot accurately compare performance or predict where a product will rank. A standardized taxonomy across all channels is a fundamental requirement.
- Pricing and Promotional Data: Accurate and time-stamped pricing data is necessary for the model to isolate the effect of a promotion versus organic demand. If promotional dates are inaccurate or missing, the model will mistakenly attribute a sales spike to a baseline demand increase, leading to wildly inflated forecasts for non-promotional periods.
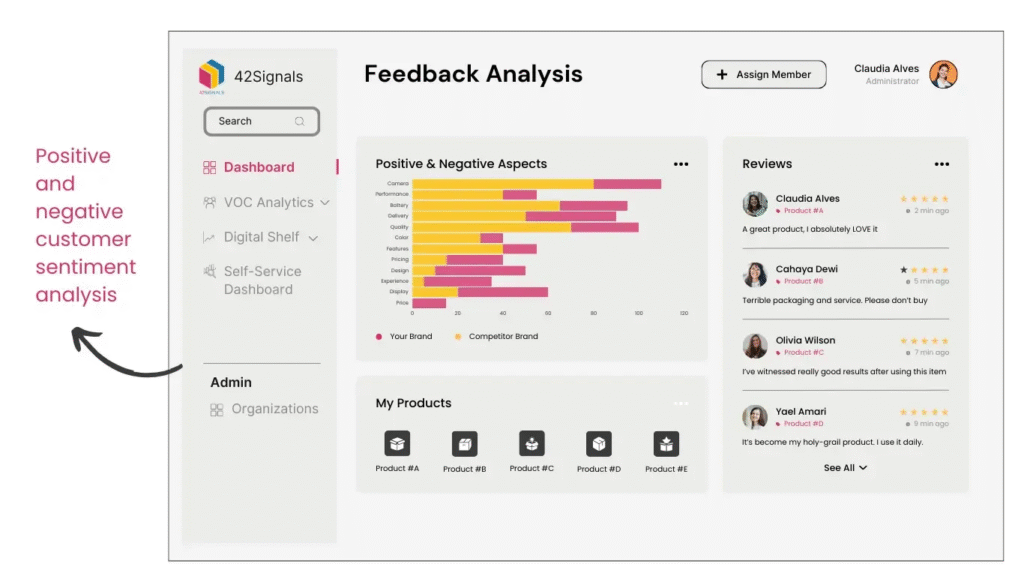
- Customer Reviews and Q&A: While this is initially unstructured text, it must be cleansed and structured—categorized by sentiment, topic, and urgency—to feed into the predictive models. Low-quality text data, full of spam or irrelevant commentary, will skew the sentiment analysis and degrade the quality of AI powered marketplace insights.
In this domain, the difference between clean and dirty data is the difference between a forecast that saves you millions by optimizing your ad spend and one that results in massive opportunity loss due to poor visibility.
The ROI of Data Governance: A Case for Prioritization
Investing in data cleaning and structuring might seem like a tedious, costly overhead activity, especially when compared to the immediate allure of a new AI algorithm. However, the return on investment (ROI) of strong data governance—the management, control, and standardization of data assets—is immense.
Numerous industry studies confirm this value. According to a Gartner study, poor data quality costs organizations an average of $12.9 million annually (Source: Gartner, “How to Stop Data Quality from Hurting Your Business,” March 2021). This is due to inaccurate decisions, wasted marketing spend, compliance penalties, and operational inefficiencies. This quantifiable loss demonstrates that data quality is not a back-office problem; it is a significant, measurable drag on profitability.
A dedicated AI data strategy must prioritize data governance. It involves establishing clear ownership of data domains, setting standards for input, and implementing automated monitoring systems. When data governance is mature, the investment in retail data analytics yields exponentially better results because the models are working with reliable, trustworthy inputs.
Moving Beyond Simple Analytics: Advanced Predictive Capabilities
When data is clean and consistently structured, retail data analytics can move beyond descriptive reporting (“What happened?”) to truly advanced predictive and prescriptive capabilities (“What will happen?” and “What should we do about it?”).
Dynamic Pricing Optimization
With high-quality transactional and competitor data, predictive models can transition from static, rule-based pricing to dynamic, real-time optimization. The model can instantly assess the impact of a competitor’s price drop, factoring in inventory levels and demand elasticity, to recommend a precise, profitable counter-price. This relies entirely on having clean, consistent, and timely data regarding price points and inventory across all channels.
Hyper-Personalization
The highest form of personalisation—recommending the perfect product, at the perfect time, through the perfect channel—requires a complete and clean 360-degree view of the customer. Every piece of customer data, from their browsing history (clean ecommerce analytics data) to their return history, must be linked accurately. Duplicates or inconsistent customer identifiers collapse this 360-degree view, turning a hyper-personalised experience into a frustrating, irrelevant one.
Supply Chain Resilience
Predicting supply chain disruptions requires integrating diverse datasets: supplier performance data, geopolitical risk data, logistics tracking, and internal demand forecasts. If any of these links in the retail data pipeline contain dirty data—such as incorrect lead times or mismatched product IDs—the models designed to build supply chain resilience will fail, leaving the retailer vulnerable to delays and stockouts.
Data as the Core Business Asset
The glamour of artificial intelligence often overshadows the hard work required to feed it. Clean, structured data is not merely a technical requirement; it is the most critical business asset in the modern retail landscape. Without a deep commitment to data quality, the promise of predictive modeling and advanced retail data analytics will remain perpetually out of reach.
For any business aiming to deploy AI powered marketplace insights or overhaul their forecasting processes, the strategic focus must shift to fortifying the retail data pipeline and implementing a rigorous AI data strategy. By making clean, structured data the priority, retailers ensure that their predictive models are built on solid ground, capable of delivering the accurate, actionable forecasts needed to thrive in a competitive, data-driven world. The unsung hero deserves its moment in the spotlight, for the quality of your future decisions rests entirely on the quality of your data today.
Try 42Signals today if you’re looking for a tool that can provide marketplace insights and quick data on your brands, along with all your important competitors.
Frequently Asked Questions
What is retail data analytics?
Retail data analytics is the practice of using data from sales, customers, pricing, promotions, inventory, and channels to understand what is happening in a retail business and to make better decisions. It connects operational signals (like stockouts, discounting, or store traffic) to business outcomes (like revenue, margin, repeat rate, and availability), so teams can act faster on what is working and fix what is leaking value.
What do data analysts do in retail?
Retail data analysts turn messy retail activity into decisions. They track performance by product, store, region, channel, and customer segment, then explain what drove changes in sales or margin. They identify issues like revenue lost to out-of-stocks, promo campaigns that inflated volume but killed profit, or assortment gaps that hurt conversion. They build dashboards and reporting logic, run experiments on pricing and promotions, forecast demand, and translate findings into actions for merchandising, supply chain, marketing, and category teams.
What are the 4 types of data analysis?
Descriptive: Summarizes what happened (sales trends, stockouts, returns, conversion changes).
Diagnostic: Explains why it happened (price changes, competitor moves, promo impact, inventory constraints).
Predictive: Estimates what will happen next (demand forecasts, churn risk, expected sell-through).
Prescriptive: Recommends what to do (replenish, reprice, change promo depth, shift budget, adjust assortment).
What are the 5 KPIs in retail?
Sales revenue: Overall growth and category or channel performance.
Gross margin (or gross profit): Profit quality, not just volume.
Conversion rate: How efficiently traffic turns into purchases.
Average order value or basket size: How much is earned per transaction.
Inventory turn or sell-through (and closely related stockout rate): How efficiently inventory converts into sales without availability loss.