Inventory Forecasting with Near-Real-Time Signals
Traditional, backwards-looking inventory forecasting is inadequate for modern retail volatility. A new approach, powered by near-real-time data signals, enables replenishment analytics. This involves continuously monitoring dynamic sell-through rates, integrating precise ETA signals for lead times, and leveraging hyper-local dark store data. By establishing a proactive, continuous inventory loop, retailers can accurately calculate stockout risk, intelligently adjust safety stock, and ultimately maximize product availability and operational efficiency while improving working capital management.
The Silent Killer of Retail Profit: Why Traditional Inventory Forecasting Fails
In the fast-paced world of modern retail, nothing is quite as frustrating—or as costly—as having the wrong amount of stock. Either you have too much, and your money is tied up in slow-moving inventory, collecting dust on a shelf (or worse, in an expensive warehouse). Or, you have too little, leading to the dreaded stockout, where a potential sale walks out the door and possibly straight to a competitor. This delicate balancing act has always been the Achilles’ heel of retail operations, and for a long time, businesses relied on historical data and gut feeling to predict future demand. The problem with this traditional approach to inventory forecasting is simple: it looks backward.
It relies heavily on last month’s, or even last year’s, sales figures. But today’s customer behavior is anything but predictable. A sudden viral trend on social media, an unexpected supply chain disruption, or even just a spell of unseasonably warm weather can instantly render months of careful, backward-looking planning useless. These methods simply can’t cope with the rapid, granular changes happening right now, leading to inaccurate predictions and, ultimately, poor product availability.
This is where the revolution begins. The sheer speed of modern commerce demands a system that operates in the moment, not in the past. It requires near-real-time intelligence to move from reactive stocking to proactive, intelligent replenishment. The introduction of dynamic, immediate data streams, like those provided by 42Signals, is fundamentally changing how retailers manage their physical and digital shelves.
See how near-real-time signals and inventory forecasting help you monitor stock levels across all channels, receive instant low-stock alerts, and optimize replenishment to eliminate stockouts and maximize revenue.Learn more about
What Is Replenishment Analytics? (And Why Traditional Models Can’t Keep Up)
Imagine trying to drive a car by only looking in the rearview mirror. That’s essentially what traditional inventory management feels like. You’re always reacting to what has already happened. To truly master the art of stocking, businesses need to embrace sophisticated replenishment analytics. This isn’t just about counting what you have; it’s about understanding the complex web of factors that dictate when, where, and how much product should be moved.
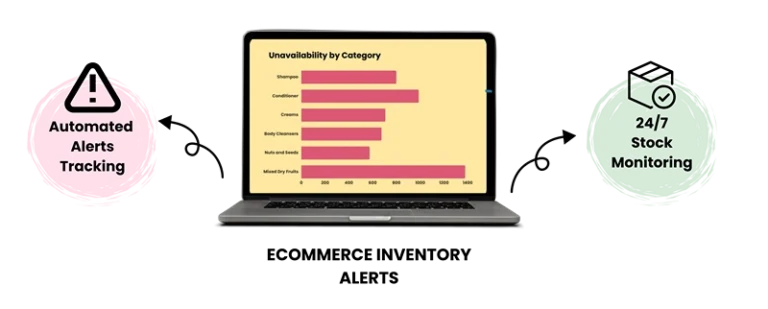
42Signals steps into this gap by providing high-frequency, near-real-time data signals through its Product Availability Analytics platform. This is an ecommerce inventory management solution that offers precise tracking, predictive analytics, and automated inventory alerts. These signals are the lifeblood of intelligent replenishment, moving beyond the simple “sales velocity” metric to incorporate a much richer set of variables.
This constant stream of current information transforms static historical spreadsheets into a living, breathing model of market reality, allowing businesses to maintain optimal stock levels and swiftly respond to low stock alerts.
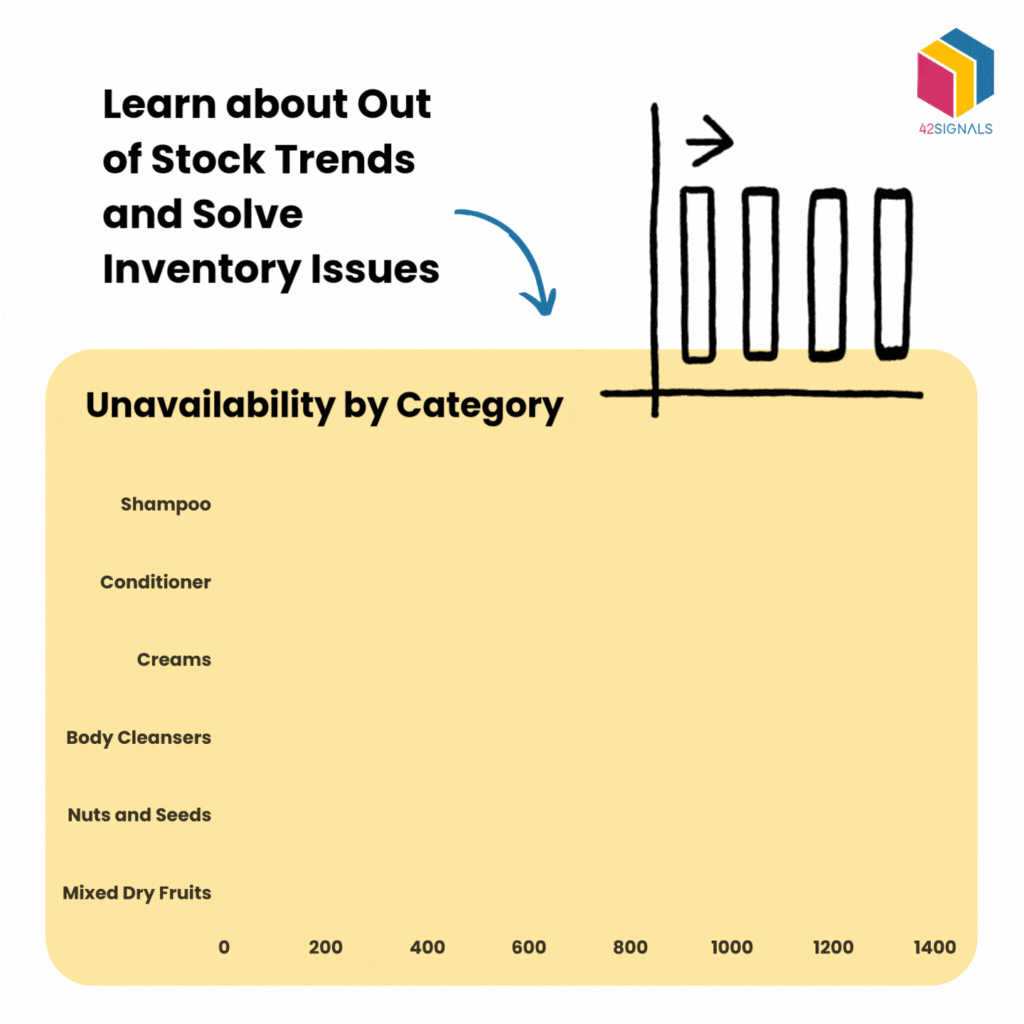
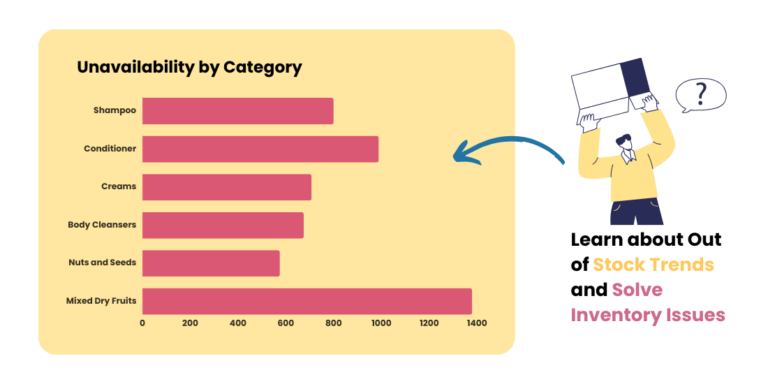
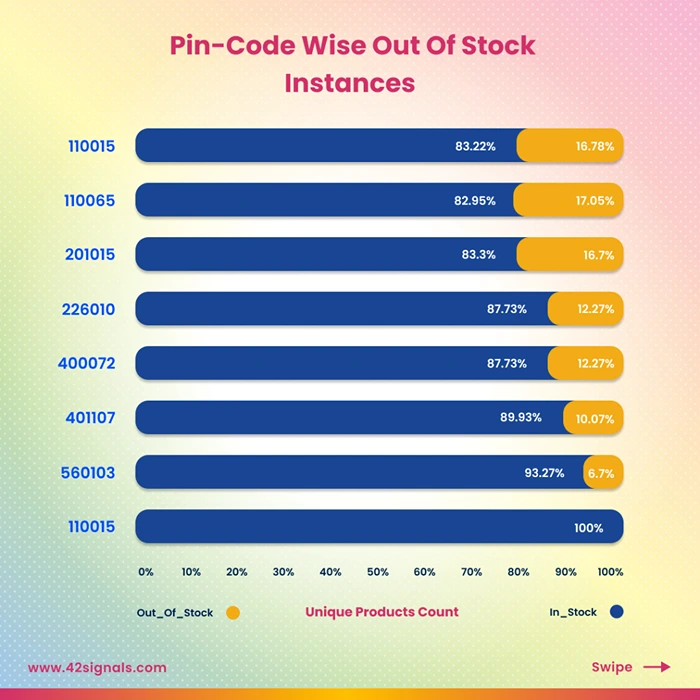
One of the most critical elements these signals capture is the true customer demand happening right now, including Pincode-Level Availability Insights to pinpoint high-demand areas. This encompasses everything from browsing behavior on an e-commerce site to actual purchases happening in physical stores or, increasingly, from distribution centers known as dark stores. By leveraging Predictive Product Analytics, the system can foresee out-of-stock situations before they happen. Businesses gain an unprecedented ability to detect subtle shifts in consumer preference or demand sensing spikes far earlier than they ever could with weekly or monthly reports, which is the foundation for avoiding the high costs associated with both overstocking and stockouts and ensuring product availability.
The system also provides Automated Stock Alerts and Competitor Stock Monitoring, allowing brands to seize market opportunities when a competitor’s product is scarce.
How Sell-Through Rates and Lead-Time Signals Drive Smarter Stock Adjustment
The core challenge in inventory management is answering two deceptively simple questions:
How fast is the product moving, and how long will it take to get more?
Dynamic Sell-Through: Gauging True Demand Sensing Velocity
The sell-through rate is a measure of how quickly a product sells over a specified period. When this data is updated only once a week, you miss crucial fluctuations. A product might look like a steady seller, but you could be missing a weekend spike that depleted your stock entirely, leading to days of missed sales.
For example, if a specific line of summer clothing starts selling twice as fast across all regional locations on a Tuesday morning compared to Monday, the system identifies this trend instantly. This immediate identification triggers a cascade of necessary actions. This isn’t about general trends; it’s about pinpointing the exact SKU, at the exact location, that is experiencing the shift, ensuring that the response is surgical and efficient.
Pinpoint Lead-Times and ETA Signals: Reducing Stockout Risk
Sell-through tells you what’s leaving; lead-time tells you what’s coming in. The time it takes for a replenishment order to move from the supplier, through transit, processing, and finally onto the shelf is the lead-time. Historically, this has often been treated as a static number. However, modern supply chains are anything but static, plagued by unexpected delays in shipping, port congestion, or warehouse processing backlogs.
By combining the dynamic sell-through rate with these accurate, near-real-time ETA signals, the system can achieve truly intelligent stock adjustment. For example, if the sell-through for a high-demand item increases sharply, and simultaneously, the ETA signal indicates a two-day delay in the next shipment, the system immediately recognizes a massive stockout risk.
This insight allows the retailer to instantly divert existing stock from a slower-performing location, or initiate an emergency cross-dock delivery, completely bypassing traditional, sluggish fulfillment processes. This proactive approach ensures better product availability where and when it is needed most.
Dark Store Inventory Management: Using Hyper-Local Data for Last-Mile Replenishment
The rise of quick commerce and rapid delivery has placed an immense strain on existing inventory models. Consumers now expect delivery in hours, not days. This has necessitated the rise of the dark store—small distribution centers or micro-fulfillment centers located close to urban populations. Managing inventory in these highly localized, high-turnover environments is exponentially more challenging than managing a large, central warehouse.
Dark store data is perhaps the most immediate and localized signal a retailer can capture. These stores operate on an entirely different rhythm than traditional retail. Their inventory turns over extremely fast, often measured in hours. A stockout in a dark store immediately translates into a failed, often cancelled, customer order.
42Signals leverages this hyper-local data to fine-tune replenishment analytics specifically for the last mile.
- Hyper-Local Demand Sensing: By monitoring the inventory level within each individual dark store, the system can detect micro-spikes in demand that wouldn’t even register on a regional report. For instance, a sudden surge in orders for grilling supplies in a single neighborhood due to an impromptu local event can be isolated and addressed instantly, preventing stockouts in that specific dark store.
- Optimized Fulfillment: The system uses dark store data to calculate the optimal size and timing of replenishment shipments from the main distribution center. Since storage space in dark stores is premium, efficiency is paramount. By knowing precisely which items are selling out and which ones are only being marginally successful, the system dictates exactly what needs to be delivered, avoiding wasted space and unnecessary transport costs.
42Signals’ quick commerce data from Swiggy
This hyper-focused application of real-time signals ensures that the last mile—the most expensive and critical leg of the journey—is executed with maximum precision, directly improving customer satisfaction and protecting margins.
The Safety Stock Myth: Defining Stockout Risk with Precision
Traditionally, safety stock—the extra inventory held to prevent stockouts—was calculated using broad averages and historical volatility. This often resulted in a “one-size-fits-all” approach that either left too much capital tied up in slow-moving items or, conversely, was insufficient for genuinely popular products. The result was unnecessary risk or unnecessary expense.
Stock Availability Analytics by 42Signals
With near-real-time signals, the calculation of safety stock moves from a blunt instrument to a finely tuned dial, primarily by accurately calculating stockout risk.
- Accurately Calculate Stockout Risk: Move beyond static averages to determine the probability of a stockout based on current sell-through and live ETA data.
- Intelligently Adjust Safety Stock: Transition from broad, historical estimates to a dynamic, data-driven safety stock calculation that reflects real-time volatility and risk.
- Optimize Working Capital: Reduce unnecessary inventory holdings by ensuring capital is only tied up protecting against quantifiable, immediate risks, freeing up funds for other investments.
Data-driven approach to safety stock ensures that capital is deployed intelligently, only protecting against risks that are visible and quantifiable in the moment. According to a study by the Council of Supply Chain Management Professionals, companies that leverage advanced analytics to optimize safety stock can reduce inventory holdings by 10% to 25% while maintaining or improving service levels. This translates directly into millions of dollars in working capital freed up.
The Continuous Inventory Loop: How Real-Time Signals Create a Self-Optimizing Replenishment System
The revolutionary aspect of using near-real-time signals from ecommerce analytics platforms is that it can transform inventory management from a series of discrete, scheduled actions (e.g., weekly ordering) into a continuous, self-optimising loop. This “continuous flow” model is the pinnacle of modern retail efficiency.
The cycle works like this:
- Signal Capture: Near-real-time data (sell-through, dark store data, lead-times, browsing behavior) is continuously streamed into the system.
- Risk Analysis: The system instantly processes this data to calculate dynamic stockout risk and forecast variances.
- Intelligent Adjustment: Based on the risk analysis, the system automatically uses replenishment analytics to determine the precise optimal level of safety stock required.
- Action Trigger: If a discrepancy is found, the system triggers the necessary action—be it adjusting an existing purchase order, diverting stock between stores, or initiating an entirely new order, all while factoring in the latest ETA signals.
- Performance Monitoring: The results of the action (e.g., improved sell-through, reduced stockout time) are immediately fed back into the signal capture stage, ensuring the system learns and refines its predictions moment by moment.
This continuous feedback loop drastically improves inventory forecasting accuracy. It allows retailers to operate with leaner inventory levels, secure in the knowledge that they can react instantly to any unexpected surge or drop in demand. The goal is no longer to be “mostly right” in your monthly planning, but to be “perfectly right” in the next few hours of operation.
The Future of Retail: Unmatched Product Availability
The shift toward near-real-time inventory management is not just an operational upgrade; it’s a fundamental competitive differentiator. In a world where customers prioritize instant gratification and seamless experiences, consistently high product availability is the ultimate promise a retailer can make.
By moving away from static models and embracing the dynamic intelligence provided by 42Signals, retailers can finally shed the burden of legacy planning and step confidently into a future of optimized efficiency. It means saying goodbye to unnecessary emergency freight shipments, costly markdowns on stale inventory, and the silent, corrosive loss of customer loyalty due to stockouts.
The implementation of advanced replenishment analytics driven by high-frequency signals is the key to unlocking true operational excellence. It allows every dollar spent on inventory to work harder and faster, ensuring that the right product is always at the right place at the right time.
Frequently Asked Questions
What is the inventory forecasting process?
Inventory forecasting is a structured process to predict future demand and translate it into “how much stock to carry and when to reorder,” while balancing service levels and cash.
A practical process looks like this:
Define scope and goal: forecast by SKU, location, and time bucket (daily, weekly, monthly), plus the service level target.
Collect and clean inputs: sales or shipments, returns, stockouts (so you don’t treat lost sales as low demand), promotions, price changes, lead times, seasonality, and new product events.
Build a baseline forecast: start with a simple model (moving average, seasonal naive, exponential smoothing) before adding complexity.
Add demand drivers: layer in promo calendars, price changes, marketing spikes, channel mix shifts, and external factors if they materially move demand.
Adjust for supply constraints: lead time variability, MOQs, supplier capacity, inbound schedules, and shelf or warehouse limits.
Convert demand forecast into inventory actions: reorder points, safety stock, order quantities, and replenishment schedules.
Monitor and recalibrate: track forecast accuracy and bias, re-train or re-tune, and handle exceptions (outliers, sudden regime changes, data issues).
What are the 4 types of forecasting?
Qualitative forecasting: judgment-based, used when history is limited (new launches, category changes).
Time-series forecasting: uses historical patterns like trend and seasonality (best for stable SKUs).
Causal or explanatory forecasting: uses drivers like price, promotions, and macro factors to explain demand.
Scenario forecasting: creates multiple “what-if” futures (best case, expected, worst case) to plan inventory risk.
How to calculate forecasted inventory?
“Forecasted inventory” usually means projected ending stock after you apply expected demand and planned supply. The simplest formula is:
Forecasted ending inventory = Beginning inventory + Incoming supply − Forecasted demand
Where:
Beginning inventory is on-hand at the start of the period.
Incoming supply includes confirmed purchase orders, inbound transfers, and planned production receipts expected in that period.
Forecasted demand is your expected sales or consumption for that period, ideally adjusted for known promos and stockout effects.
If you want to calculate how much inventory you should hold to hit a service level, you typically add a buffer:
Target inventory position = Forecasted demand over lead time + Safety stock
Inventory position means on-hand + on-order − backorders.
What are the 4 types of inventory model?
The term “inventory model” is used in two common ways. Here are four widely used inventory models that cover most planning setups:
EOQ model (Economic Order Quantity): determines an order quantity that balances ordering costs and holding costs.
Reorder point model (continuous review): triggers a reorder when inventory position hits a threshold, usually forecasted demand during lead time plus safety stock.
Periodic review model: reviews inventory at fixed intervals and orders enough to reach a target level.
Newsvendor model: a one-period model for items with short life cycles or high uncertainty (seasonal items, fashion drops), balancing overstock vs stockout cost.