Unlocking Smarter Decisions Through Retail Data Integration
Modern retailers have too much data and too little clarity. Sales live in Shopify, inventory in a warehouse system, customer data in a CRM, and competitor pricing in a spreadsheet no one trusts. This guide covers how to connect all of it — building a retail data pipeline that extracts, cleans, and loads data from every source into a centralised warehouse, then feeds a live ecommerce BI dashboard your teams can actually act on. The three use cases covered — inventory optimisation, personalised marketing, and cross-channel profitability benchmarking — show what becomes possible when your data stops living in silos and starts driving decisions.
The Retail Data Deluge: Why Integration is Non-Negotiable
The sheer volume of information generated by modern commerce is staggering. Every time a customer browses your product page, clicks an ad, uses a coupon, or returns an item, a new data point is created. For a modern retailer, this data lives in siloed systems: your Shopify store, your Amazon seller account, your point-of-sale (POS) system, your warehouse management software, and your marketing platforms.
Trying to make strategic decisions by manually piecing together spreadsheets from these disparate sources is slow, error-prone, and ultimately ineffective. This is where retail data integration becomes the backbone of your strategy.
Retail data integration is the process of combining data from these multiple, varied sources into a unified, coherent view. When done correctly, it creates a single source of truth, eliminating conflicting reports and ensuring everyone in your organization is working with the same, accurate information. This unified approach is essential for any business aiming to move beyond reactive operations to proactive, data-driven strategy. Without a clear path for integrating these systems, your most valuable insights remain trapped, hindering timely decision-making.
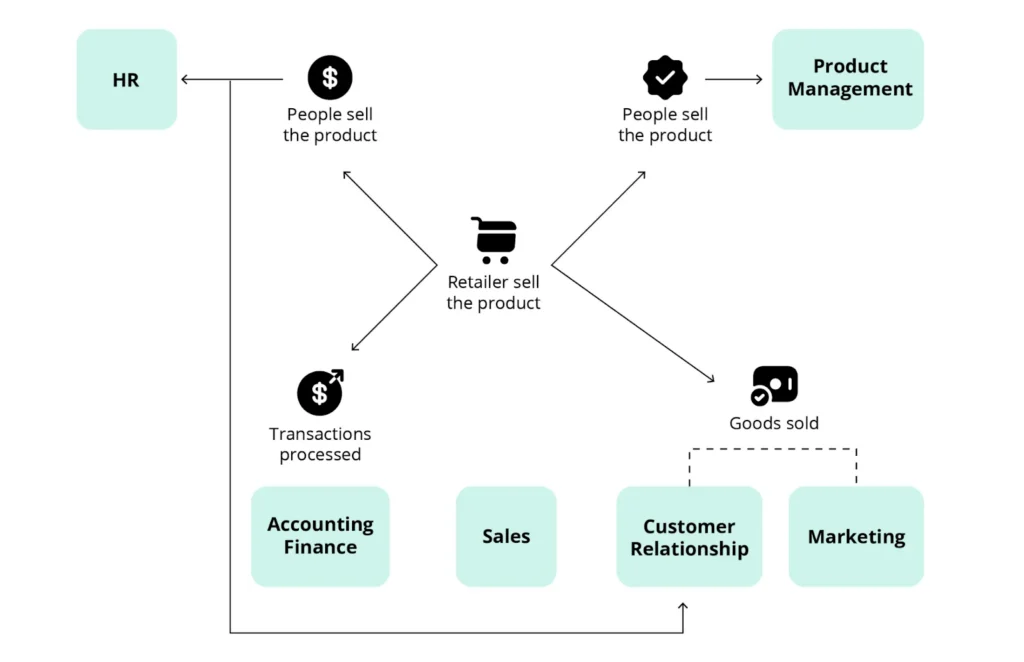
Image Source: Sempre Analytics
Building Your Retail Data Pipeline: From Source to Smarts
The journey from scattered data sources to actionable insights in a BI tool is facilitated by what’s known as a retail data pipeline. This pipeline is essentially a set of automated processes designed to extract, transform, and load (ETL) your data consistently and reliably.
Phase 1: Extraction and Source Connections
The first step in any effective retail data pipeline is connecting to your various data sources. This involves establishing secure and efficient connections to systems like:
- Ecommerce Platforms: Shopify, Magento, WooCommerce, etc.
- Marketplaces: Amazon, eBay, Walmart, etc.
- In-Store Systems: POS data, inventory scanners.
- Marketing Tools: Google Analytics, Facebook Ads, email marketing platforms.
- ERP and CRM Systems: SAP, Oracle, Salesforce.
For most modern systems, the ideal method for data extraction is using an API, specifically focusing on API integration ecommerce platforms provide. An Application Programming Interface (API) allows two software systems to communicate and exchange data securely. Using APIs ensures you are pulling the most up-to-date information without straining the source systems. For instance, a reliable marketplace data connector utilizes the marketplace’s API via marketplace data tracking to pull sales, inventory, and customer feedback data directly into your staging area.
Phase 2: Transformation and Structuring
Once the data is extracted, it’s often messy, inconsistent, and unstructured. For example, one system might list a product color as “Red,” while another uses “Crimson.” The transformation phase cleans, standardizes, and structures this data so it can be effectively analyzed.
Key transformation tasks include:
- Data Cleansing: Removing duplicates, correcting errors, and handling missing values.
- Standardization: Ensuring consistent formats for dates, currencies, and categorical data (like product names or customer regions).
- Aggregation and Calculation: Pre-calculating key metrics (e.g., daily sales totals, conversion rates) to speed up BI reporting.
This processed data is then loaded into a centralized repository, typically a data warehouse retail. A data warehouse is optimized for complex queries and analysis, making it the perfect staging ground for your BI tools with ecommerce market intelligence.
Phase 3: Loading into the Data Warehouse
Image Source: Intellias
The final step in the ETL process is loading the clean, structured data into a data warehouse retail solution. Modern cloud-based data warehouses like Snowflake, Amazon Redshift, or Google BigQuery are preferred because they offer scalability and speed necessary to handle massive amounts of retail transaction data. This centralized hub ensures that every BI report and dashboard is drawing from the exact same validated data set, a foundational step for high-quality business intelligence retail.
Selecting the Right BI Tools for Retail Insight
With a reliable retail data pipeline feeding a centralized warehouse, the next critical step is selecting the right Business Intelligence (BI) tools. The best BI platforms offer powerful visualization capabilities, user-friendly interfaces, and strong integration capabilities with your data warehouse.

Commonly used BI tools in the retail space include Tableau, Microsoft Power BI, Google Looker (formerly Data Studio), and various industry-specific platforms. When evaluating tools, consider:
- Ease of Connection: How easily does the tool connect to your data warehouse retail?
- User Interface: Is it intuitive enough for non-technical business users?
- Scalability: Can it handle the growth of your data volume and complexity?
- Visualization Features: Does it offer the chart types and interactive features necessary to communicate complex retail trends clearly?
Designing an Ecommerce BI Dashboard That Drives Operational Decisions
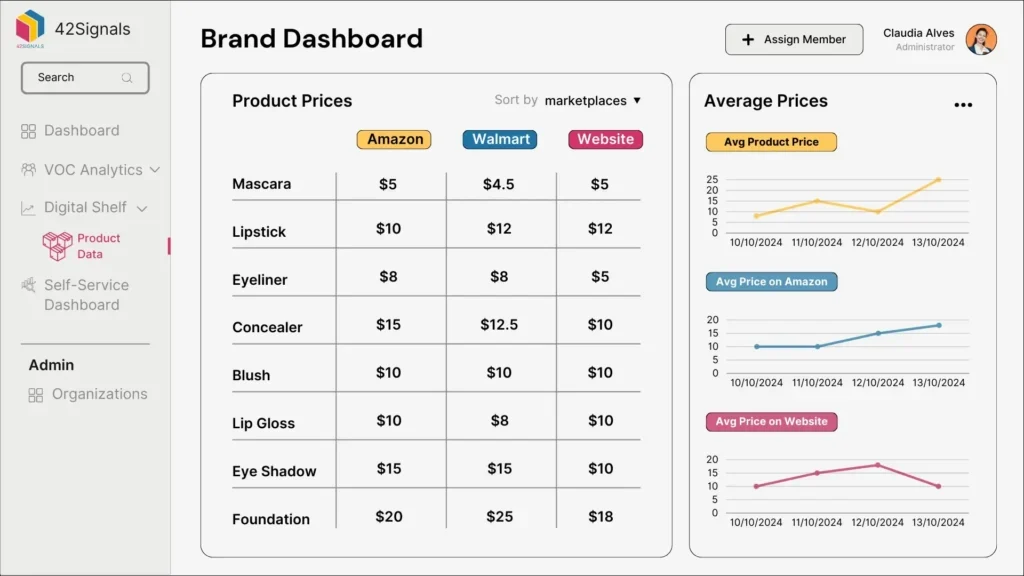
A well-designed ecommerce BI dashboard is the visual manifestation of your integrated data. It transforms complex data points into intuitive charts and graphs that help teams monitor performance and spot trends instantly. Designing one is more than just placing charts on a screen; it’s about aligning metrics with strategic business questions.
Focus on Key Retail Metrics
Your dashboard should prioritize metrics that directly reflect business health and allow for quick action. Instead of tracking every possible metric, focus on the ones that matter most:
- Sales Performance: Track Gross Merchandise Value (GMV), Average Order Value (AOV), and conversion rates segmented by channel (e.g., website, mobile app, specific marketplace data connector feed).
- Inventory Health: Monitor stock-outs, inventory turnover rate, and sell-through rates to inform purchasing and allocation.

- Customer Behavior: Visualize Customer Lifetime Value (CLV), customer acquisition cost (CAC), and cohort analysis to understand retention.
A key benefit of a unified dashboard is the ability to easily compare performance across channels. For instance, you can use the data flowing through your marketplace data connector to benchmark Amazon sales against direct-to-consumer website performance in real-time.
Operationalizing Insights: Turning Dashboards into Action
The true value of a BI tool isn’t just seeing the data; it’s about the actions you take based on those visualizations.
For example, a sudden drop in conversion rate, visible on your ecommerce BI dashboard, should trigger an investigation. Is it a technical issue? Is a competitor running a major promotion? Is the problem localized to a specific product line or geographical area? By clicking into the data, your teams can drill down to the source of the anomaly and operationalize a fix—perhaps by launching a targeted promotion or alerting the web development team to a checkout bug.
Three Retail Use Cases: From Raw Data to Operational Action
Let’s examine how integrating data leads to smarter operational decisions across different retail functions. This is where the theoretical benefit of retail data integration becomes a tangible competitive advantage.
1. Inventory and Supply Chain Optimization
Managing inventory efficiently is a tightrope walk—too much and you incur high carrying costs; too little and you miss sales opportunities (stock-outs), which makes inventory forecasting absolutely essential.
- The Integration: Connecting POS data, warehouse inventory levels, and forecasted demand (derived from marketing data) within your data warehouse retail.
- The Insight: Your BI tool identifies a 90-day trend of high sales velocity for a specific SKU that has historically been seasonal. The system flags that current stock levels will deplete in 15 days, which is shorter than the 30-day lead time.
- The Action (Operationalization): The inventory planning team is instantly alerted via the business intelligence retail dashboard and can place an emergency order or divert inventory from slower-selling regions to the high-demand areas. This reduces potential stock-outs and maximizes revenue capture.
2. Personalized Marketing and Customer Experience
Modern customers expect tailored experiences with voice of customer analytics. Generic marketing campaigns are increasingly ignored.
- The Integration: Linking customer profile data (CRM), purchase history (POS/Ecommerce), and website behavior (Analytics) via an effective retail data pipeline.
- The Insight: The BI dashboard shows that customers who purchased Product A and watched three related video tutorials on the website have a 50% higher CLV than average. The BI tool uses these variables to create a new “High-Value Engaged Shopper” segment.
- The Action (Operationalization): The marketing team uses this segment immediately. They launch a hyper-targeted email campaign offering a premium version of Product A exclusively to this group. This precise targeting, powered by integrated data, drastically improves return on ad spend (ROAS).
3. Cross-Channel Performance Benchmarking
A retailer selling on both their own website and through a major marketplace needs to understand which channel drives the most profitable sales to create a good marketplace vs D2C strategy.
- The Integration: Utilizing an API integration ecommerce strategy for the website and a dedicated marketplace data connector with price intelligence solutions for the third-party platforms, all feeding into the centralized data warehouse.
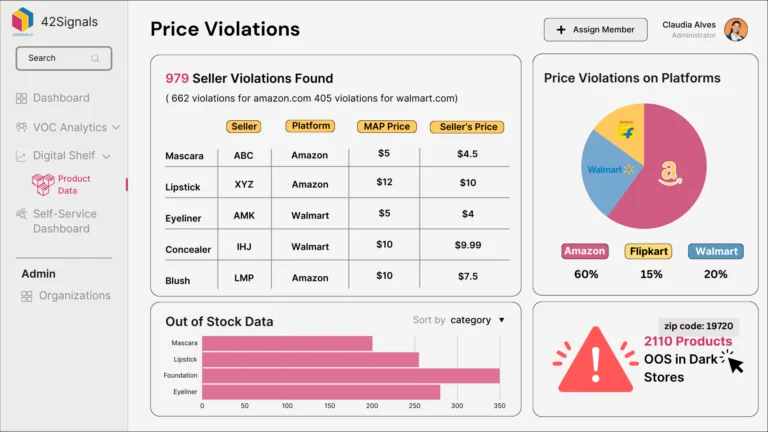
- The Insight: The integrated dashboard shows that while the marketplace drives 60% of total unit sales, the retailer’s own website sales have a 35% higher gross margin due to lower commission fees and better control over shipping costs.
- The Action (Operationalization): Leadership decides to shift marketing budget allocation, increasing investment in driving traffic to the higher-margin website and incentivizing first-time marketplace customers to make their next purchase directly. This is a direct outcome of comparing true profitability, not just raw sales volume, across all integrated channels.
Overcoming the Technical Hurdles in Retail Data Integration
While the benefits are clear, setting up a solid retail data pipeline is not without its challenges. Modern integration solutions are designed to mitigate these common pain points, making the process faster and more accessible.
Challenge 1: Data Silos and Proprietary Systems
Many older retail systems (legacy POS, older ERPs) were not designed to talk to external systems easily.
- Solution: Focus on solutions that offer a wide array of pre-built connectors, including custom marketplace data connector templates and robust tools for handling flat files (like CSVs) when API access is limited. Often, modern iPaaS (Integration Platform as a Service) solutions can act as a universal translator.
Challenge 2: Data Latency and Real-Time Needs
Retail decisions, especially in inventory and pricing, often need to be made in minutes, not hours. Batch processing that runs once a day is no longer sufficient.
- Solution: Implement an integration strategy focused on near-real-time data delivery. Modern API integration ecommerce tools allow for stream processing, where data is extracted and loaded almost immediately after a transaction occurs. This minimizes data latency and ensures that the ecommerce BI dashboard always reflects the current reality. A 2024 survey by Gartner found that organizations using real-time data integration saw a 20% faster response time to market changes compared to those relying on daily batch updates.
Challenge 3: Data Quality and Governance
Bad data leads to bad decisions. If the integrated data is full of errors, the BI output will be flawed.
- Solution: Implement automated data validation checks within the transformation phase of the retail data pipeline. This involves setting up rules to flag inconsistencies before the data reaches the data warehouse retail. Regular data audits and data governance policies—defining who owns the data and how it is updated—are crucial for maintaining trust in your business intelligence retail system.
Advanced Analytics: Beyond the Basic Ecommerce BI Dashboard
Once you have mastered the basics of retail data integration and established a foundational ecommerce BI dashboard, you can leverage your integrated data for advanced analytics and retail performance benchmarking.
Predictive Modeling
Integrated data allows you to build models that predict future outcomes. For instance, combining historical sales, promotional calendars, weather data, and website traffic (all flowing through your pipeline) allows you to accurately forecast demand for the next six months. This level of predictive insight is a game-changer for inventory planning and financial budgeting.
Customer Segmentation and Attribution
A robust retail data pipeline connects the dots between a customer’s first touchpoint (e.g., a display ad click), their purchase path (e.g., a specific marketplace data connector transaction), and their subsequent engagement. This allows for powerful multi-touch attribution modeling, showing you exactly which marketing efforts are truly driving profitable sales, moving beyond the simple “last click” model. This is the hallmark of sophisticated business intelligence retail.
Mastering Retail Data Integration for Future Growth
The future of retail belongs to those who can connect and interpret their data fastest. The ability to execute effective retail data integration is no longer a luxury—it’s a fundamental requirement for competitive advantage. By establishing a robust retail data pipeline, leveraging modern API integration ecommerce methods, and centralizing your data in a reliable data warehouse retail, you empower your teams with timely, accurate insights.
A well-designed ecommerce BI dashboard transforms confusion into clarity, enabling marketing, inventory, and leadership teams to operationalize insights rapidly and effectively. This journey toward sophisticated business intelligence retail allows you to move from guessing to knowing, securing your place in the fast-evolving retail landscape.
42Signals provides the competitive intelligence data layer your retail BI architecture is missing — real-time competitor pricing, share of search, digital shelf analytics, and VOC data, all accessible via API for direct integration into your data warehouse and BI dashboards. Book a demo, and we’ll show you how 42Signals feeds into the Tableau, Power BI, or Looker environment you’re already using.
Frequently Asked Questions (FAQs)
1. What is the difference between a data lake and a data warehouse in retail data integration?
A data lake stores raw, unstructured data at a large scale, including text files, images, and sensor data. It is often used for data science and machine learning. A data warehouse retail, conversely, stores structured, clean, and processed data optimized for reporting and analysis by BI tools. In a typical retail data pipeline, the data lake might be used as a staging area before data is structured and loaded into the warehouse.
2. How can I ensure my marketplace data connector is secure?
Security is paramount when dealing with customer and financial data. You should ensure your marketplace data connector uses industry-standard security protocols, such as OAuth 2.0, for authentication. The data should be encrypted both in transit (using SSL/TLS) and at rest within your data warehouse retail. Always use solutions from reputable providers who comply with data governance regulations relevant to your operating region.
3. What is API integration ecommerce and why is it important for my BI strategy?
API integration ecommerce refers to using Application Programming Interfaces to connect your ecommerce platform (like Shopify or Magento) with other systems, including your data pipeline. It is crucial because APIs provide a programmatic, reliable, and real-time method for extracting transactional data, inventory changes, and customer records. This ensures your ecommerce BI dashboard always displays the freshest information, enabling true real-time decision-making.
4. How often should I update the data in my ecommerce BI dashboard?
The frequency of data updates depends on the business need. For strategic reporting (like quarterly sales trends), daily updates might suffice. However, for operational metrics such as inventory levels, real-time or near-real-time updates (every 5 to 15 minutes) are necessary to prevent stock-outs or respond quickly to site performance issues. Your retail data pipeline should be configured to handle both batch and streaming data loads to support varied needs