
** TL;DR ** To effectively navigate the fast-changing electronics market, retailers should implement a weekly SKU volatility index. This involves consistently tracking key product data—including your own and competitors’ prices and stock levels—to calculate metrics like price change frequency and magnitude. By visualizing this data weekly, you gain actionable insights to proactively adjust pricing, manage inventory, and time promotions, transforming market chaos into a strategic advantage for protecting margins and growing market share.
Have you ever felt like the ground beneath your feet is constantly shifting when you try to set prices for your electronics store? One day, a popular laptop is flying off the shelves at a premium, and the next week, a competitor’s flash sale makes your inventory look overpriced. This isn’t just intuition. It is the direct result of extreme volatility in the electronics market. For anyone involved in selling gadgets, from smartphones to components, staying static is a recipe for falling behind. You need an approach centred around understanding your SKU data.
Understanding the Heartbeat of Your Business: What is SKU Data?
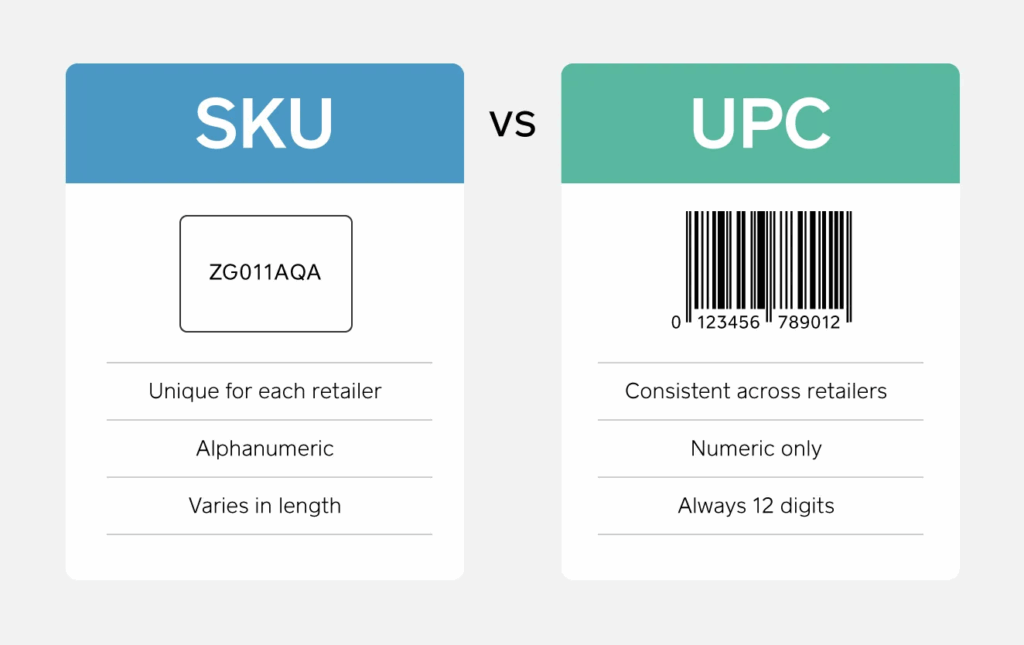
Image Source: Square Up
Let us start with the basics. SKU stands for Stock Keeping Unit. It is that unique code you assign to every single product variation you carry. That specific model of a gaming monitor with the exact screen size, refresh rate, and color? It has its own SKU.
The wireless earbuds in black versus white? Different SKUs. Your SKU data, therefore, is the complete lifecycle story of each item. It is not just a price tag. It encompasses the current price, cost, competitor prices, stock availability, historical pricing trends, and sales velocity.
Think of your entire electronics catalogue as a bustling city. Each SKU is a building. SKU data gives you the blueprint, the current occupancy, the rent compared to neighboring buildings, and how many people are moving in or out each week. Without paying attention to these individual blueprints, you are just seeing a skyline from afar.
You miss the critical details. In fast-moving sectors like consumer electronics, where a new model can depreciate a previous version in months, this granular view is everything. It is the foundation of any serious price tracking electronics strategy.
Why SKU Volatility Demands Your Weekly Attention
You might wonder, why make this a weekly ritual? Can monthly checks suffice? The short answer is no, especially in electronics. The product lifecycle is brutally short. According to a report by Deloitte, the rapid pace of innovation leads to constant product refreshes, creating relentless pressure on older inventory. This translates to frequent and sometimes dramatic price adjustments across the market.

When you track volatility weekly, you move from reacting to anticipating. A sudden 15 percent price drop on a key competitor’s best-selling tablet is not just a one-off event. It is a signal. It might indicate a clearing of stock before a new launch, a strategic move to capture market share, or a response to shifting component costs.
If you only catch this a month later, you have likely already lost significant sales and margin. Weekly tracking allows you to see patterns, not just points. It helps you answer questions like:
- Are certain categories more unstable than others?
- How do our pricing actions in week one affect competitor reactions in week two?
This rhythm turns raw SKU data into a strategic dashboard.
Building Your Weekly SKU Volatility Index: A Step-by-Step Guide

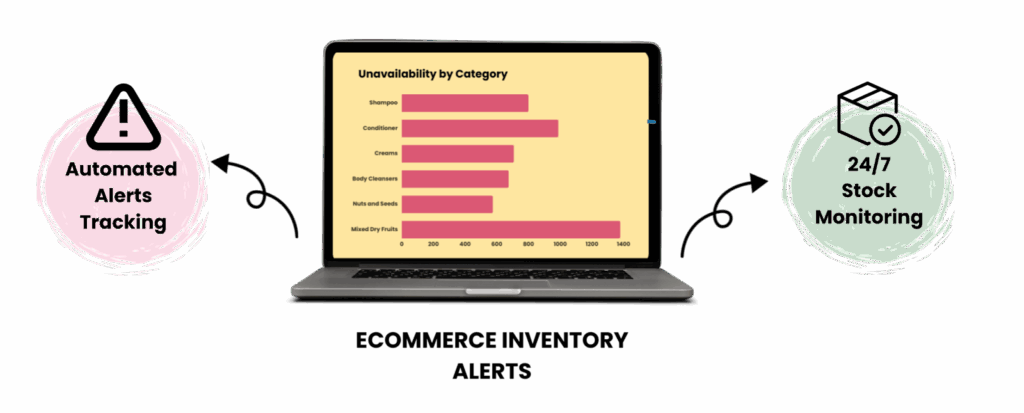
Image Source: 42Signals’ Product Availability
Creating your index doesn’t require expensive software from day one. You can start with a disciplined process and spreadsheet. The goal is consistency. Here is how to build it.
Step 1: Define Your Core SKU Universe
You cannot track everything. Start by identifying your 50 to 100 most important SKUs. These should be your best sellers, your key competitors’ best sellers, and new products with high potential. These items are the bellwethers for your category.
Their volatility often ripples out to affect other products. For each, ensure you have pristine base SKU data: your cost, your current retail price, and direct links to the product pages on at least three major competitor sites.
Step 2: Gather the Weekly Data Points
Every week, on the same day (e.g., every Monday morning), you will become a data collector. For each SKU tracking, record four crucial pieces of information.

Image Source: Product Availability by 42Signals
- First, log your own selling price and stock level.
- Second, visit the competitor pages and record their current selling price and stock availability (e.g., “In Stock,” “Low Stock,” “Out of Stock”).
- Third, note any promotional flags like “Sale,” “Clearance,” or “Limited Time Offer.”
- Fourth, track the Manufacturer’s Suggested Retail Price (MSRP) if it has changed.
This process of competitor pricing intelligence is the fuel for your index.
Step 3: Calculate the Volatility Metrics
Now, transform those raw numbers into insights. In your spreadsheet, create columns to calculate weekly changes.
The most important metric is the Price Change Frequency.
- How many of your tracked SKUs changed price (yours or a competitor’s) since last week? A high percentage indicates a turbulent market.
- Next, calculate the Average Price Change Magnitude. When prices do change, by what average percentage did they move? A market where many prices change by small amounts is different from one where few prices change by large, dramatic swings.
- Finally, create a simple Stock Availability Score, like the percentage of tracked SKUs that are “In Stock” at key retailers. A plunging score can signal supply chain issues or a hot product trend.
Step 4: Visualize and Interpret the Index
Numbers in a table can be dry. Create a simple line chart that plots your key metrics—Price Change Frequency and Average Change Magnitude—over time. This visual is your Weekly SKU Volatility Index. The line isn’t important on any single Monday.
Its power is in the trend over four, eight, or twelve weeks.
- Is the line climbing steadily? That means the market is getting more unpredictable, and you may need to review prices more aggressively.
- Is it flat or falling? The market might be in a stable period, allowing you to focus on other strategies. This index stops you from overreacting to a single bad week or getting complacent during a calm one.
Turning Volatility Insights into Profitable Actions
An index is just a thermometer. It tells you the temperature but doesn’t cool the room. The real value is in the actions you take based on the insights from your SKU data.
For Pricing Strategists: Your weekly index directly informs electronics pricing decisions. If volatility is high, it might validate a more dynamic pricing model to stay competitive. If you notice a competitor consistently out of stock on a high-volatility item, it might present an opportunity to hold your price firm or even increase it slightly, knowing supply is constrained. Conversely, if everyone is in stock and prices are falling, a pre-emptive, competitive price drop might protect your sales volume.
For Inventory and Purchasing Managers: Pricing trends and stock availability data are early warning systems. A sustained period of price declines across a category, like wireless headphones, often precedes a new product launch. Having price alerts and inventory intelligence can help you negotiate better terms with suppliers or reduce order quantities to avoid being stuck with obsolete stock. Similarly, spotting a trend where a product is consistently out of stock everywhere can inform a decision to secure more inventory, even at a slightly higher cost, to meet unmet demand.
For Marketing and Promotions Teams: Understanding volatility helps time your campaigns. Launching a major promotion on an item during a week of extreme competitor price cuts might drown out your message. Instead, use a calm period in your index to make a splash with a promotion, capturing attention when the market noise is lower. Your competitor pricing data can also help craft compelling messaging, allowing you to confidently promote price-match guarantees or highlight true value differentiation.
Key Takeaways
- A Weekly Index is Essential: Monthly tracking is too slow for electronics. A disciplined weekly review of SKU data is necessary to spot trends and anticipate market moves rather than just react to them.
- Start with Core Products: Focus on a manageable universe of 50-100 high-impact SKUs, tracking their price, competitor price, and stock availability every week to build your dataset.
- Measure Frequency and Magnitude: The most useful metrics are how many prices changed in a week and the average size of those changes. Plotting these over time creates your clear volatility index.
- Data Informs Multiple Decisions: Insights from the index directly guide smarter pricing strategies, more accurate inventory purchasing, and better-timed marketing campaigns.
- Build Long-Term Intelligence: Committing to this process creates a valuable historical record, helping you predict seasonal patterns and transition from a reactive to a proactive, market-shaping strategy.
The Long-Term Advantage: From Reacting to Shaping the Market
Committing to a weekly SKU volatility index does more than just optimize today’s prices. It builds institutional knowledge. Over quarters and years, you will amass a historical dataset of pricing trends and SKU data that is incredibly valuable. You can start to predict seasonal patterns specific to your niche in consumer electronics. You can identify which competitors are price leaders and which are followers. This knowledge informs everything from annual budget forecasts to negotiations for market share.
You begin to see not just what is happening, but why it might be happening. This transition from a reactive stance to a proactive, informed strategy is the ultimate competitive edge. In a sector where margins are tight and product windows are short, the business that understands the rhythm of volatility is the one that dances ahead of the competition.
In conclusion, tracking SKU volatility through a dedicated weekly index is no longer a luxury for electronics retailers. It is a fundamental practice for survival and growth.
By systematically gathering SKU data, monitoring competitor pricing, and interpreting the signals for stock availability and pricing trends, you transform market noise into a clear strategic signal. You make decisions based on evidence.
Try 42Signals today to see this data in action – track your inventory, out-of-stock situations on platforms, and dark store inventory in easy steps.
Frequently Asked Questions
1. What is SKU in data?
An SKU (Stock Keeping Unit) in data refers to the unique identifier assigned to each product or product variation a business sells. In analytics, an SKU is used to track inventory levels, sales performance, pricing, stock movements, and product attributes.
It helps retailers and e-commerce brands analyze performance at a granular level — for example, distinguishing between a shoe in size 9 vs. size 10, even if they’re the same model.
2. What is SKU with an example?
An SKU is a code—usually alphanumeric—that represents a specific product variation.
Example: A T-shirt brand selling one design in three sizes and two colors would have six SKUs:
Red / Small
Red / Medium
Red / Large
Blue / Small
Blue / Medium
Blue / Large
Each variation has its own SKU so the brand can track sales, stock levels, and performance independently.
3. What are the 4 types of inventory?
The four main types of inventory most businesses manage are:
Raw Materials – Basic components used to make finished products.
Work-in-Progress (WIP) – Items that are partially completed during production.
Finished Goods – Completed products ready to be sold.
Maintenance, Repair, and Operations (MRO) – Supplies needed for production but not part of the final product (e.g., gloves, tools, cleaning materials).
4. What are the 5 basic types of inventories?
Some models expand inventory types into five categories:
Raw Materials
Work-in-Progress (WIP)
Finished Goods
Packaging Materials – Boxes, labels, inserts, and shipping supplies.
Safety Stock – Extra inventory held to prevent stockouts during demand spikes or supply delays.
5. What is the ABC type of inventory?
ABC inventory classification is a method of ranking products based on their value or importance:
A Items: High-value products that contribute the most to revenue, often 10–20% of items making up 70–80% of value.
B Items: Moderate-value items with average sales volume.
C Items: Low-value items that make up a large portion of inventory but contribute less to revenue.
ABC analysis helps businesses prioritize inventory management and allocate resources wisely.
6. What are the three methods of inventory?
The three primary inventory valuation methods used in accounting are:
FIFO (First-In, First-Out): Oldest inventory is sold first. Common in perishable or fast-moving goods.
LIFO (Last-In, First-Out): Newest inventory is sold first. Often used in industries where prices fluctuate.
Weighted Average Cost (WAC): Inventory cost is calculated by averaging the cost of all units available for sale.
Each method affects profit, taxes, and balance sheet value differently, depending on price movements.