** TL;DR ** This comprehensive guide details how e-commerce businesses can close the “Visibility Gap” and unlock hidden revenue through systematic assortment analytics. The process involves a three-phase audit: first, diagnosing product invisibility by analyzing competitive marketplace data and keyword ranking to check for first page visibility; second, quantifying the lost revenue by calculating the Opportunity Cost of Invisibility; and finally, optimizing the product assortment using advanced product listing SEO and expanding strategically based on data-driven keyword suggestions. The key takeaway is that continuous assortment analytics turns product invisibility into a measurable financial problem, justifying the necessary investments to achieve maximum sales and visibility.
Have you ever felt like your products are the best-kept secret on the internet? You know they’re great, your team is working hard, but when you search for them on major online marketplaces or even your own site, they seem… invisible. In today’s hyper-competitive digital landscape, being hard to find is the same as not existing. This feeling of ‘invisibility’ in key retail channels is not just frustrating; it’s a direct, quantifiable hit to your bottom line.
This article is your comprehensive guide to addressing that exact problem. We are going to dive deep into the world of assortment analytics, showing you how to systematically audit where your products are—and aren’t—appearing, and, most importantly, how to put a dollar value on the sales you’re currently missing. By the end, you’ll have a clear framework for turning hidden potential into tangible revenue.
Why Your Products are Hiding: Understanding Assortment Analytics
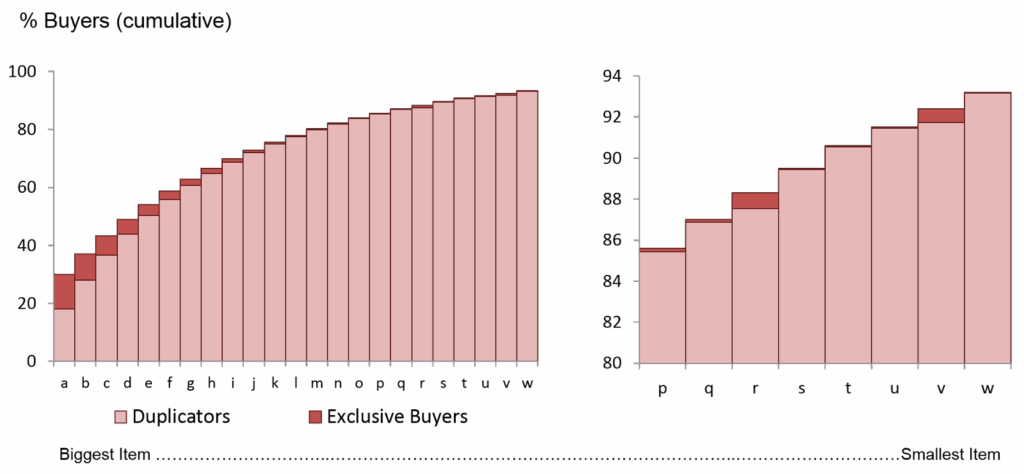
Image Source: Ashok Charan
It’s easy to assume that if you list a product, customers will find it. Unfortunately, the reality is far more complex. Modern e-commerce is dictated by algorithms, rich competitive landscapes, and rapidly shifting consumer search behavior. Your product’s listing is one thing, but its visibility is an entirely separate challenge.
The assortment challenge boils down to ensuring the right products are presented to the right customers at the right moment across all the places you sell. This isn’t just about stocking shelves; it’s about digital shelf management.
The True Cost of ‘Invisible’ Inventory
When a product is invisible, it’s not just a missed sale for that single item; it represents a failure of your entire assortment strategy. This invisibility can manifest in a few ways:
- Out of Stock (OOS) Issues: The product should be there, but stockouts mean lost sales and frustrated customers who might jump to a competitor.
- Poor Search Ranking: Your item exists, but it’s languishing on page seven, far beyond where any customer is willing to click. This is often an issue of product listing SEO.
- Assortment Gaps: You simply don’t offer a key product variant or category that your competitors are capitalizing on. You’re missing a piece of the puzzle.
- Superseded Listings: The right product is available, but a poorly optimized, older, or duplicate listing is ranking higher, confusing customers and diluting sales.

Understanding these pain points is the first step in leveraging assortment analytics to regain control.
Shedding Light on the Digital Shelf: The Power of Assortment Analytics
Assortment analytics is the systematic process of gathering, analyzing, and acting upon data related to your product mix and its performance across all sales channels. It goes beyond simple sales reporting to measure presence, availability, and competitive standing.
Think of it as an X-ray of your digital storefront revealed by digital shelf analytics. It reveals the structural integrity of your product presence, not just the facade. Good assortment analytics help you answer fundamental questions about your business health:
- Which of my top 10 products are failing to achieve first page visibility on the main channels?
- How does my total product count compare to my nearest competitors on key marketplace data aggregators?
- Which customer searches are we completely ignoring because we don’t have the relevant products, or our product descriptions are too weak?
Moving Beyond Simple Spreadsheets
Many companies start with manual audits—checking search rankings for a handful of products on a few key terms. While this offers a snapshot, it’s not scalable or comprehensive. Effective assortment analytics relies on continuous, large-scale data ingestion and processing. This allows you to monitor thousands of products against millions of search queries, providing a dynamic view of your market position.
This kind of analysis provides the essential context for your inventory and pricing decisions, ensuring that your inventory investment is driving maximum visibility and sales.
Phase 1: Diagnosing the Assortment Gaps Using Marketplace Data
The first and most critical step in this audit is to understand what the customer sees, which requires gathering robust marketplace data. You need to look outside your four walls and use data that reflects real-world shopper behavior.
1. Identifying the Competitive Product Assortment Landscape
Before you fix your own house, you need to know the neighborhood. The total size and scope of your competitors’ product assortment set the bar for customer expectation.
This involves looking at your top rivals and quantifying their offerings:
- Category Overlap: Which categories do you share, and where are they specializing? If they have 50% more products in a niche you consider core, that’s a significant visibility advantage for them.
- New Product Velocity: How quickly are they introducing new products? A competitor constantly refreshing their product assortment signals dynamism that search algorithms often reward.
- Pricing Clusters: Are they dominating the budget-friendly or the premium end of the spectrum? Your visibility might be hampered if you’re trying to compete in a crowded mid-market space.
By mapping this competitive landscape, you immediately reveal the largest structural gaps in your own product assortment strategy. If your primary keyword is used frequently to search for a product you don’t carry, that’s a clear lost revenue opportunity.
2. Auditing First Page Visibility and Keyword Ranking
Visibility isn’t about existing; it’s about ranking on the first page visibility of search results. Studies consistently show that the vast majority of clicks (often 70% or more) go to results on the first page, with a steep drop-off thereafter.
Your audit must systematically track the following:
- Primary Keyword Tracking: For your top 100 products, where do they rank for the core commercial keywords? If the rank is consistently below position 10, your visibility is effectively zero.
- Long-Tail Keyword Coverage: Are you capturing the highly specific, lower-volume searches that indicate high purchase intent? This is where good product listing SEO shines. Look at your competitors’ successful listings for keyword suggestions you might be missing.
- Availability Tracking: A product might rank well, but if it shows as ‘Out of Stock’ (OOS) in the search result snippet or on the landing page, the effort is wasted. This is a critical metric found through advanced assortment analytics.
By tracking these elements, you move past anecdotal evidence and rely on hard numbers. If 40% of your key products are outside of first page visibility, you have a serious, measurable problem.
Phase 2: Quantifying Lost Revenue Through Assortment Metrics
This is where the rubber meets the road. Simply identifying gaps isn’t enough; you need to attach a financial figure to those gaps to justify the investment in fixing them. The goal is to calculate the Opportunity Cost of Invisibility.
A Framework for Lost Revenue Calculation
The basic formula for lost revenue (LR) from an assortment gap or poor visibility is:
LR = Potential Demand (Volume) x Conversion Rate (CR) x Average Selling Price (ASP)
To make this formula actionable, we need to estimate the three components using marketplace data and internal metrics.
1. Estimating Potential Demand (Volume)
This is the hardest part and relies heavily on external data or estimations:
- Competitive Proxy: Look at the sales volume of the top 3 competitors for a missing product or category. Use this as a conservative estimate of the demand you could capture. If a competitor sells an estimated 1,000 units per month of a product you lack, your potential demand is at least 1,000 units.
- Search Volume Analysis: Use tools to analyze the volume for your target keyword ranking. A high-volume keyword with low existing product coverage indicates untapped demand. Assume you could capture a small percentage (e.g., 5-10%) of that monthly search volume.
2. Utilizing Internal Conversion Rate (CR)
Use your existing internal data. If your average conversion rate for a similar product category is 3%, use that figure. If the visibility issue is poor keyword ranking, you might use a lower conversion rate (e.g., 1.5%) to be conservative, acknowledging that even if found, the listing might be sub-optimal.
3. Defining Average Selling Price (ASP)
Use the actual or estimated selling price for the product or product category. If you are auditing a missing product, use the competitor’s average price as your proxy.
Example: Calculating Revenue Lost to a Visibility Gap
Let’s say your assortment analytics reveal that a high-value product, which you know sells well, has dropped from position 5 to position 15 for your primary keyword: “premium leather wallets.”
| Metric | Data Point | Source |
|---|---|---|
| Search Volume (Primary Keyword) | 5,000 searches/month | Third-Party SEO Tool |
| Click-Through Rate (CTR) at Pos. 5 | 10% | Industry Benchmark/Internal Data |
| Click-Through Rate (CTR) at Pos. 15 | 1% | Industry Benchmark/Internal Data |
| Potential Clicks Lost (Volume) | 450 clicks (500-50) | Calculation |
| Conversion Rate (CR) | 4% | Internal Data |
| Average Selling Price (ASP) | $50 | Internal Data |
| Estimated Lost Revenue (Monthly) | 450 Clicks * 4% CR * $50 ASP = $900 | Calculation |
By performing this analysis across dozens or even hundreds of products, the cumulative lost revenue quickly reaches a magnitude that demands immediate action and validates your investment in improved assortment analytics. The total figure represents the minimum return you can expect from fixing the visibility issues.
Phase 3: Optimizing Your Assortment for Maximum Visibility
Once the gaps are quantified, the focus shifts to strategic optimization. This involves a two-pronged approach: improving existing listings and strategically expanding your product assortment.
1. Mastering Product Listing SEO and Product Descriptions
The quality of your digital content is the foundation of visibility. Search algorithms, whether on Google or major marketplaces, reward relevance and completeness.
- Deep Keyword Integration: Move beyond just mentioning the primary keyword. Integrate secondary and semantic keywords naturally into the title, bullet points, and the main product descriptions. Look at high-ranking competitor listings and identify the keyword suggestions they are using that you are missing. For example, if you sell a “stainless steel water bottle,” semantic keywords like “BPA-free,” “double-walled insulation,” and “sweat-proof grip” must be present.
- Content Completeness: Incomplete listings are penalized. Ensure every required field is filled out, including high-resolution images, detailed specifications, and videos where possible. This improves not only ranking but also the conversion rate once the customer lands on the page.
- Optimizing Backend Search Terms: Many marketplaces offer hidden fields for backend search terms. Use these wisely, integrating variations, common misspellings, and long-tail phrases that don’t fit cleanly into the customer-facing product descriptions. This is a powerful, low-effort way to boost your keyword ranking.
2. Strategic Assortment Expansion Based on Data
Not every gap requires you to launch a new product, but some certainly do. Use your assortment analytics to guide these investment decisions.
- Filling Competitive Gaps: If your marketplace data shows a competitor successfully dominating a sub-niche (e.g., “extra-large outdoor gear”) that you only partially cover, consider launching specific SKUs to close that gap. The lost revenue calculation provides the ceiling for your development budget.
- Utilizing Keyword Suggestions for New Variants: High-volume keyword suggestions with low product count on the marketplace are the sweet spot for new product launches. If you see high search volume for “eco-friendly hiking socks” but your assortment only contains standard “hiking socks,” the data suggests a clear path for expansion.
- Managing the Tail: Assortment analytics also informs contraction. Identify low-visibility, low-selling items that are draining inventory resources or polluting search results. Strategically removing or consolidating these poor performers can free up capital and effort to invest in the high-visibility winners, improving overall first page visibility.
3. Leveraging Marketplace Data for Dynamic Pricing and Promotions
Visibility is also heavily influenced by pricing and promotional activity. Algorithms often boost products that are competitively priced and converting well.
- Competitor Price Monitoring: Continuous monitoring of marketplace data allows you to dynamically adjust your pricing to remain competitive without sacrificing margin. Being too high or too low can both hurt visibility—you need to find the sweet spot that the market rewards.
- Visibility-Driven Promotions: Use promotions strategically to lift products suffering from poor keyword ranking. A temporary price drop can lead to a surge in sales, which, in turn, boosts organic ranking long after the promotion ends. This is a common tactic to break the barrier of invisibility.
Continuous Monitoring: Assortment Analytics as an Ongoing Practice
The digital shelf is constantly moving. Competitors launch new products, algorithms change, and customer searches evolve. Therefore, assortment analytics cannot be a one-time audit; it must be a continuous, cyclical process.
Establishing Key Performance Indicators (KPIs)
To maintain high visibility, you need to track specific, actionable metrics derived from your assortment analytics:
| KPI | Description | Target Improvement (Example) |
|---|---|---|
| First Page Visibility Rate | The percentage of your key SKUs ranking in the top 10 for their primary keyword. | Increase from 55% to 75% |
| Assortment Gap Coverage | The number of high-volume competitive keyword suggestions now covered by your product assortment. | Increase by 15 new keyword clusters per quarter. |
| Stockout Rate (OOS) | The percentage of time a key product is listed as out of stock on key channels (derived from marketplace data). | Maintain below 2%. |
| Average Keyword Rank | The average position of your top 100 products for their key search terms. | Improve from 12.5 to 8.0. |
The Human Element in Assortment Analytics
While data tools are essential, the human touch remains vital. Assortment analytics tools provide the ‘what’—the data points, the ranking drop, and the lost revenue calculation. Your team provides the ‘why’ and the ‘how’.
A human team must regularly review the competitive marketplace data to:
- Interpret Algorithm Shifts: Did a new factor influence keyword ranking? Was it image quality, faster shipping, or a new seller badge? Data points need human interpretation to create actionable strategies.
- Curate Product Descriptions: Ensure that the product descriptions not only satisfy the algorithm but also speak directly to the customer in a conversational tone, answering their questions and building trust.
- Identify Emerging Semantic Keywords: Human insight, based on customer reviews and support tickets, can often pinpoint semantic keywords and keyword suggestions long before automated tools flag them as high-volume, giving you a valuable head start.
Turning Invisibility into Dominance with Assortment Analytics
The era of passive e-commerce is over. Success is no longer guaranteed by simply having a good product; it is defined by the relentless pursuit of high first page visibility across all channels.
By adopting a rigorous framework for assortment analytics, you transform the vague feeling of “being invisible” into a precise, quantifiable problem that can be solved. You gain the power to audit your product assortment, use rich marketplace data to estimate potential demand, and confidently quantify the lost revenue resulting from poor keyword ranking or inadequate product listing SEO.
Try 42Signals to audit your digital shelf and get quick results. Speak with us for a personalised demo for your brand.
Frequently Asked Questions (FAQs) on Assortment Analytics
1. What is assortment analytics?
Assortment analytics is the process of analyzing the mix of products a business offers to understand whether it meets customer demand and business goals. It examines which products sell well, which underperform, where gaps exist, and how assortment compares with competitors.
Retailers and e-commerce brands use assortment analytics to decide:
Which products to add or remove
How deep or wide a category should be
Whether they are overstocked or under-represented in certain segments
How assortment impacts revenue, margins, and customer satisfaction
The goal is to offer the right products, in the right variety, at the right time.
2. What does an assortment analyst do?
An assortment analyst studies product performance data to help businesses design an effective product mix. Their responsibilities typically include:
Tracking sales and demand at SKU and category levels
Identifying slow-moving or redundant products
Analyzing customer preferences and buying patterns
Comparing assortment with competitors
Supporting decisions on product launches, delisting, or expansion
Working with pricing, merchandising, and supply chain teams
Their role ensures the assortment is optimized for both customer needs and profitability.
3. What are the 4 types of analytics?
The four main types of analytics used in business and data analysis are:
Descriptive Analytics – Explains what happened using historical data.
Diagnostic Analytics – Explains why something happened by identifying causes.
Predictive Analytics – Forecasts what is likely to happen next.
Prescriptive Analytics – Recommends actions to achieve the best outcome.
Assortment analytics often uses all four to guide smarter merchandising decisions.
4. What does assortment mean?
Assortment refers to the complete range of products a business offers within a category or across its entire catalog. It includes product variety, size options, brands, price tiers, and features.
A well-planned assortment balances:
Customer choice
Inventory efficiency
Shelf or digital space constraints
Profitability
In both physical and digital retail, assortment directly influences customer satisfaction and sales performance.