** TL;DR ** Digital shelf analytics is the essential system for monitoring and optimizing how your products appear and perform across all online retailers, acting as a hidden sales engine that directly drives revenue by ensuring maximum product visibility through share of search, competitive pricing, compelling content, positive reviews, and reliable availability, transforming raw data from your digital shelf into actionable strategies that convert browsers into buyers and protect your profits in the competitive ecommerce landscape.
Imagine walking into a massive, endless supermarket. This supermarket is open 24/7, it spans the entire globe, and your competitors’ products are placed right next to yours on the same shelf. Now, imagine you’re blindfolded. You can’t see if your product is in stock, if the price tag is correct, if a rival’s item has a flashy promotional banner you don’t, or if a customer just put your product in their cart and then changed their mind.
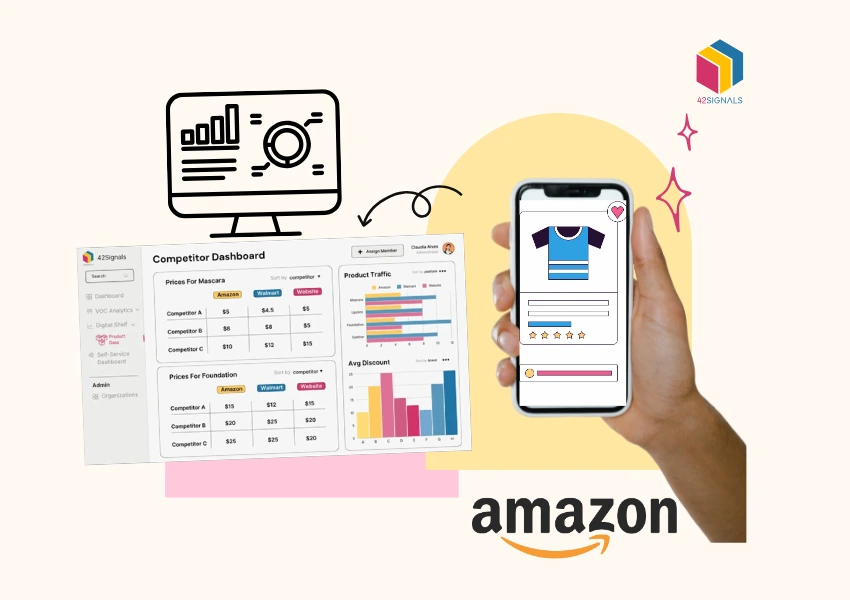
This is the reality for brands selling online without digital shelf analytics. In the physical world, you have managers who walk the aisles. In the digital world, digital shelf analytics is your eyes, ears, and strategic brain. It is the process of collecting, analyzing, and acting on data about how your products are presented and discovered across every online retailer, marketplace, and digital touchpoint.
Demystifying ECommerce with Digital Shelf Analytics
Image Source: Xtract
Before we dive into the analytics, let’s solidify what we mean by the “digital shelf.” It is the online equivalent of a physical store’s shelf space. But it’s far more dynamic and complex.
- It’s Multidimensional: A physical shelf holds a product. A digital shelf holds that product’s images, title, description, videos, ratings, reviews, Q&A section, price, availability status, and promotional badges. Every single element influences the customer’s decision.
- It’s Everywhere: Your digital shelf exists on Amazon, Walmart.com, Target.com, Amazon.com, your own website, and hundreds of other specialty online retailers. Your product’s presence on each is a unique instance that needs management.
- It’s Governed by Algorithms: Unlike a static physical shelf, placement on the digital shelf is determined by search algorithms and ranking systems. Product visibility isn’t guaranteed by paying for a slot; it’s earned through optimization and performance.
In short, the digital shelf is the entire online shopping experience that surrounds your product, from the moment a customer searches until they click “add to cart.” Optimizing this space is the core of shelf optimization for the modern age.
What Exactly is Digital Shelf Analytics?
Digital shelf analytics is the systematic approach to understanding and optimizing that complex environment. It moves you from being the blindfolded brand to being an insightful, proactive retailer.
Think of it as a central command dashboard for all your online sales channels. Instead of manually checking each product page on every site (an impossible task at scale), this technology aggregates data to give you insights on critical questions: Are my product pages accurate and compelling? Am I in stock? Is my price competitive? How are my products ranking in search results? What are customers saying in reviews?
A robust digital shelf analytics platform doesn’t just report problems; it highlights opportunities. It transforms raw data into actionable strategies to win more clicks, more conversions, and ultimately, more revenue. The next sections will break down the key components that make this possible.
The Core Components of Your Analytics Powerhouse
A powerful analytics strategy is built on several interconnected pillars. Each one addresses a fundamental question about your performance.
1. Share of Search: Your True Market Visibility
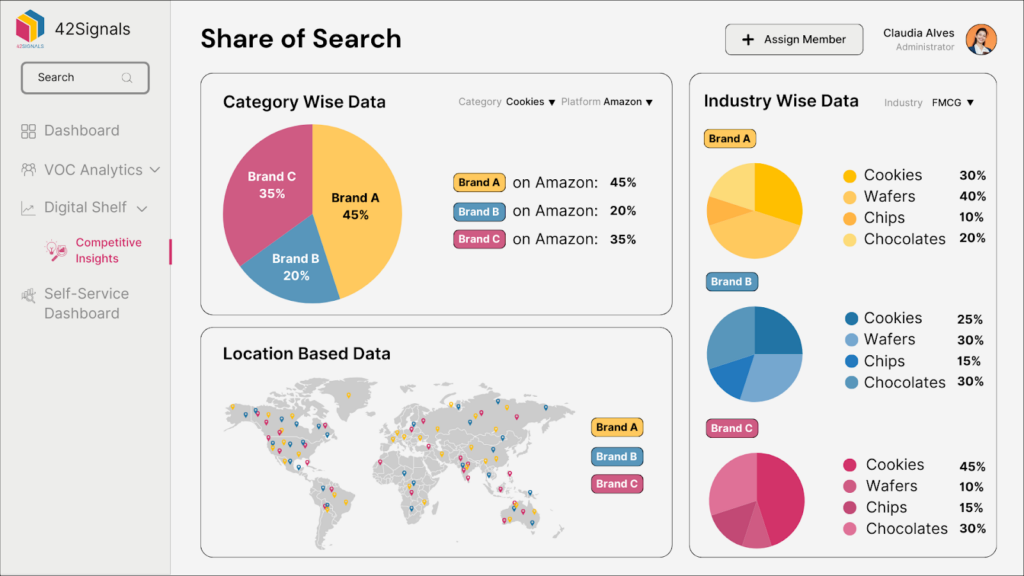
Share of search is one of the most critical metrics in ecommerce. It measures how often your products appear in search results for relevant keywords compared to your competitors. Think of it as your digital shelf space allocation. If 100 people search for “wireless bluetooth headphones,” and your brand’s products show up in 25 of those search result sets, you have a 25% share of search.
Why does this matter? A study by Momentum Commerce analyzing Amazon data consistently shows a strong correlation between share of search and actual market share. It’s a leading indicator of sales performance.
By tracking this, you understand your true marketplace SEO visibility and can strategize on how to capture more of those precious search impressions through better content and relevance.
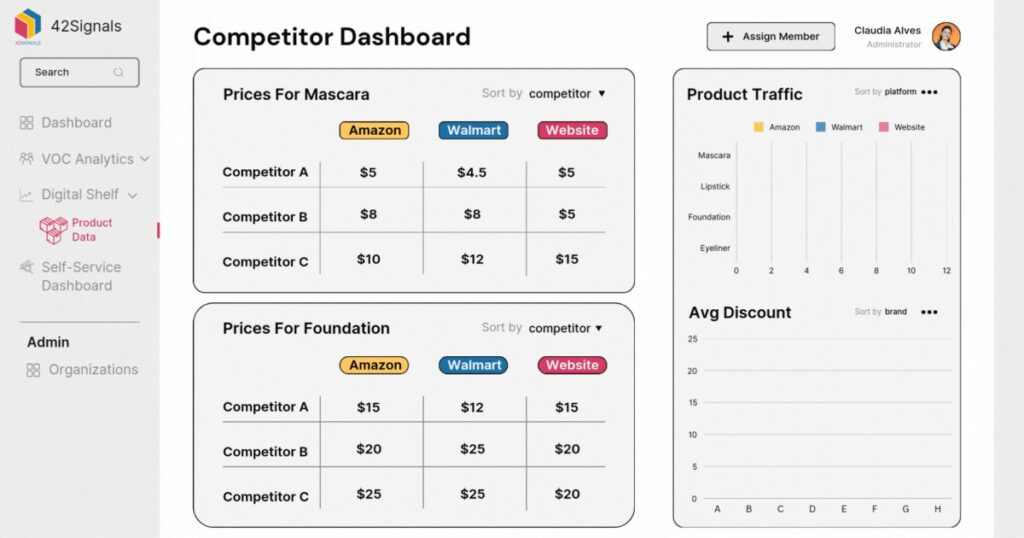
2. Competitor Monitoring: Knowing the Playing Field
You cannot operate in a vacuum. Competitor analysis involves continuously tracking your rivals’ actions across the digital shelf. This goes beyond just noting their price.
- Price Tracking: Are they undercutting you? Did they launch a promotion?
- Content Analysis: Have they updated their images or description with new features or better copy?
- Promotional Activity: Are they using “Amazon’s Choice” or “Best Seller” badges? Are they running sponsored display ads you’re not?
- Stock Status: Is their out-of-stock moment your opportunity to gain sales?
This intelligence allows you to make informed, reactive, and proactive decisions to protect and grow your market position.
3. Keyword Analysis: The Foundation of Discovery
If share of search is the goal, keyword analysis is the roadmap. This involves identifying the exact words and phrases real shoppers use to find products like yours. It means understanding the difference between high-volume “head terms” (e.g., “laptop”) and more specific, intent-driven “long-tail keywords” (e.g., “lightweight laptop for college students 2024”).

By optimizing your product content titles, descriptions, and backend search terms with the right keywords, you signal relevance to platform algorithms. This improves your organic keyword ranking, increases your share of search, and drives qualified traffic to your listings. Without this, even the best product can remain invisible.
4. MAP Violation Tracking: Protecting Your Brand and Margins
For many brands, maintaining a Minimum Advertised Price (MAP) is crucial for protecting brand value, retailer relationships, and profit margins. MAP violation tracking is a specialized function of digital shelf analytics that automatically scours the web to find retailers advertising your products below your agreed-upon MAP price.
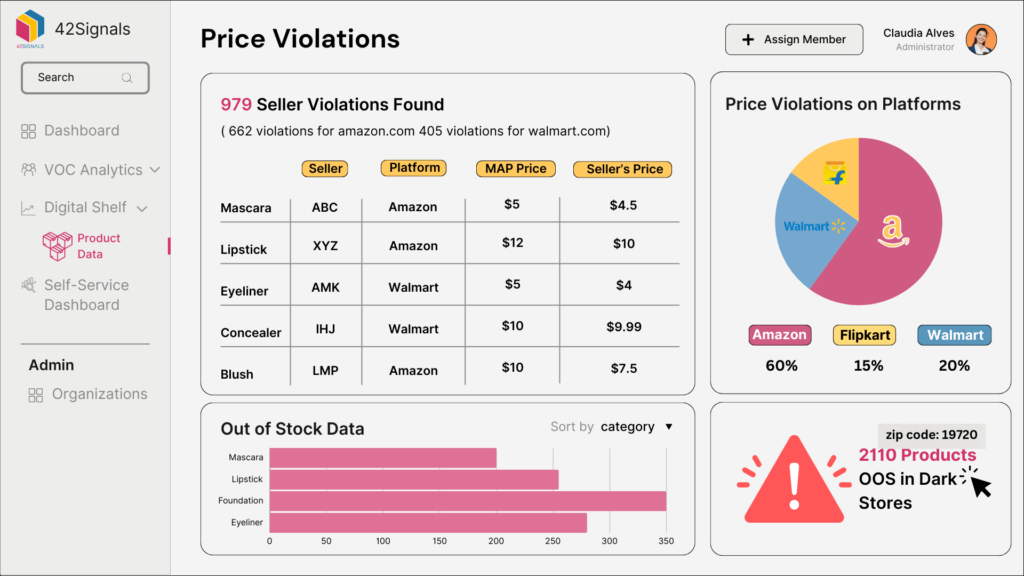
Unchecked MAP violations create a race to the bottom, erode brand prestige, and anger your compliant retail partners. Automated tracking alerts you to violations immediately, allowing for swift enforcement and preserving your pricing integrity across all channels.
5. Display Ad Banner Tracking: Auditing Your Digital Promotions
When you invest in sponsored product ads or display ad banner tracking on retail sites, you need to know your investment is being executed correctly.
- Is your ad live? Is it showing on the right product pages?
- Is a competitor’s ad appearing on your product page, hijacking your hard-earned traffic?

Display ad banner tracking uses technology to verify the placement and context of your paid advertising campaigns. This ensures your ad spend is effective and not being wasted or, worse, directly benefiting a competitor. According to a 2023 report by eMarketer, retail media network ad spending is soaring, making this oversight more valuable than ever.
The Direct Line to Revenue: How Analytics Drive Sales
This is where the rubber meets the road. How do these components translate into cold, hard cash? The connection is direct and powerful, some of which can be seen with assortment analytics.
1. Converting Browsers into Buyers
Every product detail page is a salesperson. A poor one loses the sale. A great one closes it. Digital shelf analytics directly fuels your conversion rate by ensuring every “salesperson” is perfectly trained and equipped.
Consider a product page missing key images, using a vague title, or harboring negative reviews at the top. Analytics pinpoint these exact deficiencies. For instance, correcting a “bad” product page to a “good” one isn’t theoretical. While specific numbers vary by category, comprehensive case studies, such as those cited by ecommerce platform providers like Salsify, consistently show that brands optimizing their digital shelf content see conversion rate lifts of 10%, 20%, or even more.
This happens because you’re systematically removing friction and doubt. A customer finds your product, sees high-quality images from every angle, reads a description that answers their specific questions, and is reassured by recent positive reviews. That’s a frictionless path to “Add to Cart.” Shelf optimization through analytics is the process of building that path across your entire catalog.
2. Capturing “Ready-to-Buy” Demand
In ecommerce, intent is immediate. A shopper searching for your specific model number is signaling the highest possible purchase intent. If they find an “out of stock” message, that revenue instantly evaporates, likely to a competitor who is in stock. Here, digital shelf analytics acts as your real-time inventory sentry.
The revenue loss from stockouts is staggering. According to a 2022 report by IHL Group, retailers globally lose over $1.8 trillion annually due to out-of-stock and overstock issues. For a brand, a stockout on a major retailer’s site doesn’t just mean one lost sale; it damages your share of search.
Algorithms demote unavailable products, making you less visible even when you are back in stock. Analytics platforms that monitor real-time availability allow your supply chain and sales teams to act before a critical stockout occurs, shifting inventory between channels or triggering expedited replenishment. This is revenue protection in its purest form, ensuring you capture the demand you’ve worked so hard to generate through marketing and SEO.
3. Winning the Price Perception Battle
Price is the ultimate conversion trigger for many shoppers. But pricing in a vacuum is a dangerous game. Digital shelf analytics provides the competitive intelligence to price strategically, not reactively.
This goes beyond simple undercutting. It involves understanding your product’s price positioning relative to specific competitors and the broader market. For example, analytics might reveal that your product maintains a strong conversion rate even at a 5% premium over a key rival, signaling perceived superior value.
Conversely, you might discover that for a different, more commoditized product, you are consistently 10% higher and losing share of search because of it. This allows for surgical pricing adjustments. Furthermore, tracking promotional cadences (like a competitor who discounts every other weekend) lets you time your promotions for maximum impact, perhaps launching yours just as theirs ends to capture the price-sensitive shoppers they awakened.
This strategic pricing, informed by continuous data, maximizes both sales volume and profit margins.
4. Leveraging Social Proof at Scale
Ratings and reviews are the bedrock of online trust. Digital shelf analytics transforms this social proof from a passive element into an active revenue driver. It does this by tracking not just your score, but the sentiment, content, and trends within your reviews.
Imagine analytics software flags a sudden spike in 3-star reviews. Drilling down, you see a common complaint: “Battery doesn’t last as long as advertised.” This is critical intelligence. Your product team can investigate a potential batch issue. More immediately, your content team can update the product description to manage expectations or highlight accessory items like portable chargers.
You can also use this insight to guide your review generation strategy, proactively asking customers who purchased a power-efficient accessory to share their experience. This active management creates a virtuous cycle: better products and clearer communication lead to better reviews, which lead to higher conversion rates and more sales, which generate more reviews.
A study from the Spiegel Research Center found that nearly 95% of shoppers read reviews before making a purchase, and products with reviews can see conversion rates up to 270% higher than those without. Analytics is the tool that lets you consciously build this asset.
5. Optimizing Ad Spend for Maximum ROI
For most brands, retail media ads (like Amazon Sponsored Products or Walmart Connect) are a significant and growing line item. Digital shelf analytics ensures this spend directly fuels market share gains, turning it from a generic cost into a precise investment.
The key connection is between your advertising and your share of search. A well-structured analytics program shows you which keywords you already rank well for organically and which are highly competitive gaps. This allows you to allocate your ad budget to defend your strong positions and attack critical weaknesses. For example, you might use display ad banner tracking to confirm your banner is appearing on high-intent category pages, then use share of search data to measure if that campaign is increasing your visibility for those category terms.
Furthermore, by monitoring your organic search performance alongside your ad spend, you can identify “halo effects” where paid campaigns lift organic ranking over time, proving long-term ROI. This integration ensures you are not just buying clicks, but strategically purchasing incremental marketplace visibility that compounds into sustained revenue growth.
In essence, digital shelf analytics closes the loop on the entire ecommerce performance cycle. It identifies leaks in your revenue funnel, whether from poor content, stockouts, or mispricing, and provides the actionable data to plug them. It highlights opportunities to accelerate growth through superior content, review management, and intelligent advertising.
Every function it performs—from MAP violation tracking to competitor monitoring—is ultimately in service of one goal: driving more profitable sales. It is the system that makes your revenue predictable and scalable in the digital aisles.
Implementing a Winning Digital Shelf Strategy
Knowing that digital shelf analytics drives revenue is the conviction. Building a program that consistently delivers those results is the execution. This journey from insight to outcome requires a thoughtful, structured approach. It’s less about flipping a switch and more about building a new muscle within your organization. Here is a practical, step-by-step guide to implementation.
Phase 1: The Honest Assessment – Understanding Your Starting Point
Before investing in tools or hiring teams, conduct a clear-eyed audit of your current digital shelf health. This is your baseline.
- Manual Shelf Walk: Choose your 3-5 top products on your 2-3 most important retailers (e.g., Amazon, Walmart, Target). Manually inspect every element: title, images, description, features, reviews, price, availability, and competitor presence. Take screenshots. Note discrepancies between retailers. This hands-on exercise, though limited in scale, builds crucial empathy for the challenge and highlights immediate, glaring issues.
- Gather Your Data Silos: Talk to your teams. Sales has retailer reports. Marketing has brand content and advertising metrics. Supply chain has inventory data. Customer service has complaint logs. The problem is that this data lives in separate silos, preventing a unified view. The goal of this phase is to recognize these disconnects.
Your assessment should answer:
- How do we currently track our online presence?
- What are our biggest pain points (e.g., constant MAP violations, declining review ratings, stockout complaints)?
Phase 2: Building Your Tech Foundation – Choosing the Right Platform
You cannot manage millions of data points across thousands of product pages manually. Selecting the right digital shelf analytics platform is your most critical technical decision. Look for a solution that offers:
- Comprehensive Retailer Coverage: It must cover all your current and planned sales channels.
- Integrated Core Components: Ensure it robustly handles share of search measurement, competitor monitoring, keyword analysis, MAP violation tracking, and display ad banner tracking in a single dashboard.
- Actionable Alerts, Not Just Data: The platform should proactively notify the right person (e.g., “Product X is out of stock on Amazon,” “Competitor Y dropped price by 15% on Walmart,” “MAP violation detected on Z site”) rather than forcing teams to hunt for insights in reports.
- Customizable Reporting: Different stakeholders need different views. The sales team needs retailer-specific performance reports. The marketing team needs content scorecards. The executive team needs a high-level revenue health dashboard.
When evaluating vendors, ask for case studies relevant to your LOB and insist on a pilot project focused on a specific product category to test the quality and actionability of the data.
Pro Tip:
42Signals provides all of these features and more with our customizable solutions for ecommerce brands.
Phase 3: Aligning Your Human Engine – Cross-Functional Ownership
Technology is an enabler, but people drive change. The single biggest reason digital shelf programs fail is organizational silos. You must form a dedicated, cross-functional team, often called an “ecommerce operations” or “digital shelf team.” This doesn’t always mean new hires; it means clarifying ownership from existing roles.
- Ecommerce Manager/Owner: Drives the strategy, oversees the platform, and coordinates cross-functional actions.
- Marketing/Brand Team: Owns the content assets (copy, images, video) and is responsible for improving content completeness and scores based on analytics.
- Sales/Account Management: Uses retailer-specific insights to partner with key accounts (e.g., presenting data to an Amazon buyer to argue for better placement).
- Supply Chain/Operations: Responsible for acting on inventory and stockout alerts to maintain availability.
- Finance/Pricing: Sets pricing strategy and relies on MAP violation tracking and competitive price data to inform decisions.
Regular (e.g., weekly or bi-weekly) stand-up meetings with this group are essential to review alerts, assign tasks, and track progress against KPIs.
Phase 4: Operationalizing Insights – From Dashboard to Action
This is where strategy becomes routine. Build processes that ensure analytics insights don’t just spark discussion but trigger definitive action.
- Create Playbooks: Document standard responses to common alerts. What is the step-by-step process when a MAP violation is detected? Who is contacted first? What is the escalation path? What is the process for updating a batch of product images based on poor performance scores? Playbooks turn panic into procedure.
- Integrate with Workflow Tools: Connect your analytics platform to communication tools like Slack or Microsoft Teams for critical alerts. Use project management tools like Asana or Jira to turn an insight (e.g., “Product description score is low”) into a tracked task assigned to the content manager with a deadline.
- Establish a Content Governance Calendar: Shelf optimization is not a one-time project. Set a recurring schedule for auditing and refreshing key product content, informed by performance data and keyword analysis trends. Plan updates around new product launches, seasonal changes, and campaign cycles.
Phase 5: The Cycle of Continuous Optimization – Test, Measure, Refine
A mature digital shelf strategy embraces a test-and-learn mentality. Your analytics platform provides the perfect laboratory.
- Run Controlled Experiments: Use the natural variation across retailers to test hypotheses. For example, deploy two different product title structures on Amazon and Walmart.com (where shopper search behavior may differ). Measure the impact on click-through rate from search pages. Or, test a new set of infographic images on a subset of products and monitor changes in conversion rate.
- Benchmark and Set Progressive Goals: Your initial KPIs might be foundational, like achieving 100% content completeness. Once achieved, set more advanced goals, like increasing share of search for your top 10 keywords by 15% in the next quarter, or improving the average star rating of your flagship product from 4.2 to 4.5.
- Expand Scope Strategically: Start with a focused pilot—perhaps your top 20 SKUs on Amazon. Prove the ROI, refine your processes, and then scale. Add more retailers, more product categories, and more sophisticated analysis, like tracking the impact of a wholesale price change on downstream retailer pricing and marketplace visibility.
Key Takeaways: Your Digital Shelf Analytics Checklist

Before we wrap up, let’s distill the essential lessons from this deep dive into digital shelf analytics. Think of this as your quick-reference guide for transforming your online sales approach.
- The Digital Shelf is Your New Primary Sales Channel. It encompasses every element a shopper sees online—images, copy, price, reviews, availability—and exists across dozens of retailer sites. Winning here isn’t optional; it’s where the majority of commerce is now conducted.
- Analytics Provides the Vision You Currently Lack. Without a systematic approach, you are essentially managing your online presence blindfolded. Digital shelf analytics acts as your central command center, replacing guesswork with data on product visibility, competitor actions, and content performance.
- “Share of Search” is a Leading Revenue Indicator. Your share of search—how often your products appear in relevant search results—is a powerful predictor of market share. Increasing it through strategic keyword analysis and content optimization is a direct path to growing sales.
- Every Component Directly Impacts Profit. From MAP violation tracking protecting your brand’s price integrity to competitor monitoring informing your pricing strategy, each function of analytics defends revenue or creates new opportunities. Even display ad banner tracking ensures your promotional spend is effective, not wasted.
- Implementation Requires Technology AND People. Success depends on choosing the right analytics platform and breaking down internal silos. A cross-functional team—spanning marketing, sales, supply chain, and finance—must own the insights and act on them with defined processes.
- It’s a Cycle of Continuous Improvement. A winning strategy is not a one-time project. It involves regularly auditing performance, testing new content approaches, and refining tactics based on data. The digital shelf is dynamic, and your management of it must be too.
Conclusion: From Hidden Engine to Your Core Strategy
We began by picturing an endless, global supermarket where your products compete for attention in a blindingly fast and algorithmic environment. The central truth we’ve uncovered is that in this environment, digital shelf analytics is not merely a helpful tool for the marketing or ecommerce team. It is the fundamental operational system for modern revenue generation.
What makes it a “hidden” sales engine is that its work happens in the background, in the data layer of ecommerce. Its outputs aren’t always flashy campaigns, but they are infinitely more powerful: consistent in-stock status, competitively compelling product pages, trustworthy social proof, and intelligent pricing. These are the factors that, day after day, tip the buying decision in your favor at the moment of maximum intent.
The shift from physical to digital retail required a new skill set. Where once a retail manager walked the aisles, now your brand needs a data-driven command center. Digital shelf performance analytics provides that. It transforms the chaotic, multi-channel digital landscape into a measurable, manageable, and optimizable asset. It draws a straight, undeniable line from the hygiene of your product content to the health of your quarterly revenue.
The question for any brand today is no longer if you should invest in this capability, but how quickly you can build it. The competitors who already have are gaining marketplace visibility, eroding your share of search, and capturing the customers you are working hard to attract. They have turned their digital shelf monitoring from a passive display into an active, intelligent sales engine.
Your path forward is clear. Start the audit. Build the cross-functional team. Invest in the technology. Begin measuring what truly matters on the digital shelf. By doing so, you will move this engine from the shadows and place it at the very heart of your commercial strategy, where it will drive sustainable growth for years to come.
Schedule a demo with 42Signals to see how this data can work for your brand.
Frequently Asked Questions
1. What are the 4 types of digital analytics?
The four main types of digital analytics describe how data is used to understand performance and guide decisions:
Descriptive Analytics Explains what has already happened. Example: website traffic last month, conversion rates, or sales numbers.
Diagnostic Analytics Explains why something happened. Example: identifying why conversions dropped after a price change.
Predictive Analytics Estimates what is likely to happen next using historical trends and patterns. Example: forecasting next month’s sales.
Prescriptive Analytics Recommends what action should be taken. Example: suggesting the best price to maximize revenue based on demand and competition.
Together, these four types move a business from reporting → understanding → forecasting → decision-making.
2. What does digital shelf mean?
The digital shelf refers to how products appear, perform, and compete across online platforms such as e-commerce websites, marketplaces, mobile apps, and search results.
It includes everything a shopper sees before buying:
Product title and description
Images and videos
Price and discounts
Reviews and ratings
Availability and delivery speed
Search rank and category placement
In simple terms, the digital shelf is the online version of a store shelf, where visibility directly impacts sales.
3. What do you mean by digital analytics?
Digital analytics is the practice of collecting and analyzing data from digital platforms such as websites, mobile apps, marketplaces, and online campaigns. It helps businesses understand how users behave online and how digital performance connects to revenue.
Digital analytics is used to measure:
Website traffic and engagement
Conversion rates
Marketing campaign performance
User journeys and drop-off points
Pricing and promotion effectiveness
It turns online activity into clear performance insights.
4. What is digital shelf performance?
Digital shelf performance measures how well a product performs in online marketplaces and e-commerce platforms. It focuses on visibility, competitiveness, and conversion strength.
Key indicators include:
Search ranking and share of search
Pricing competitiveness
Stock availability
Review volume and sentiment
Content accuracy
Buy Box ownership
Strong digital shelf performance means your products are easy to find, attract clicks, convert into sales, and stay competitive over time.
5. What data sources feed digital shelf analytics?
Digital shelf analytics uses data from:
E-commerce platforms and marketplaces
Brand websites
Search results and keyword rankings
Customer reviews and ratings
Stock availability and fulfillment feeds
Competitor product listings
Together, these sources create a live picture of how a product is competing online.
6. What is the difference between digital shelf analytics and e-commerce analytics?
E-commerce analytics focuses on your own store performance such as traffic, conversion, and revenue.
Digital shelf analytics extends beyond your store and tracks:
How competitors price products
How your product ranks in searches
Who owns the Buy Box
Where you are losing visibility or demand
Digital shelf analytics is outward-looking. E-commerce analytics is inward-looking.
7. How does digital shelf analytics support brand growth?
It helps brands:
Detect lost visibility before sales drop
Respond instantly to competitor price changes
Spot content errors that hurt conversions
Track availability gaps across retailers
Understand why market share shifts
This turns digital shelf management from manual monitoring into a predictive growth engine.