If you’re selling products online or in-store, chances are that you’re drowning in data. But not all analytics tools are created equal. Some spit out fancy charts but leave you clueless about what to do to boost sales. Others overwhelm you with metrics that don’t connect to your bottom line. So, how do you pick software that turns data into dollars? Let’s look at how retail analytics software helps.
Choosing a Retail Analytics Software That Boosts Sales
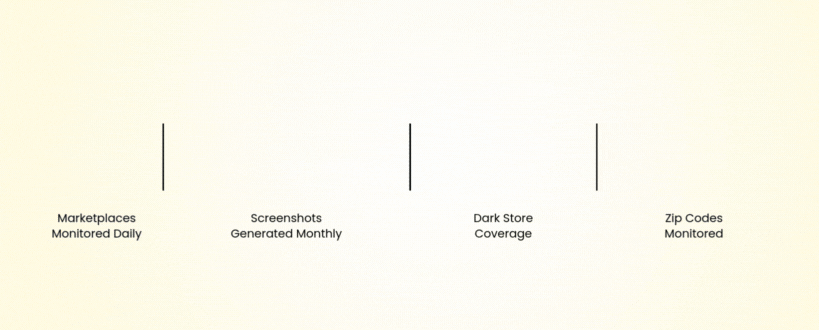
A retail analytics software should have features that help analyze performance across marketplaces and provide it in a digestible chunk of either visual dashboards or data sets.
1. Omnichannel Analytics: Stop Guessing Where Sales Come From

Image Source: LinkedIn
Imagine a situation where a customer sees your Instagram ad, clicks to your website, abandons their cart, and then buys the item two days later in your store. If your analytics tool can’t connect those dots, you’re not working with the right information. That’s where omnichannel analytics shines. It stitches together data from every touchpoint—social media, websites, apps, brick-and-mortar—so you see the whole story, not fragments.
Why It Matters
Modern shoppers don’t stick to one channel. They might browse on mobile, compare prices on a desktop, and finally purchase in-store. Without omnichannel insights, you’re left with disconnected data points that don’t reveal how marketing efforts, inventory, or customer behavior intersect.
For example, a retailer might pour money into Google Ads but fail to realize that those clicks only convert when paired with an email reminder sent two days later.
What to Look For
- Real-time synchronization: Tools like Adobe Analytics or Salesforce Commerce Cloud update data instantly, so you’re not making decisions based on yesterday’s numbers.
- Cross-channel attribution: Does your TikTok ad deserve credit for an in-store sale? Look for models like “time decay” (giving more weight to the last touchpoint) or “position-based” (crediting the first and last interactions).
- Inventory integration: If your online stock doesn’t match warehouse levels, you risk overselling. Retail analytics software like Oracle NetSuite syncs inventory across channels to prevent this.
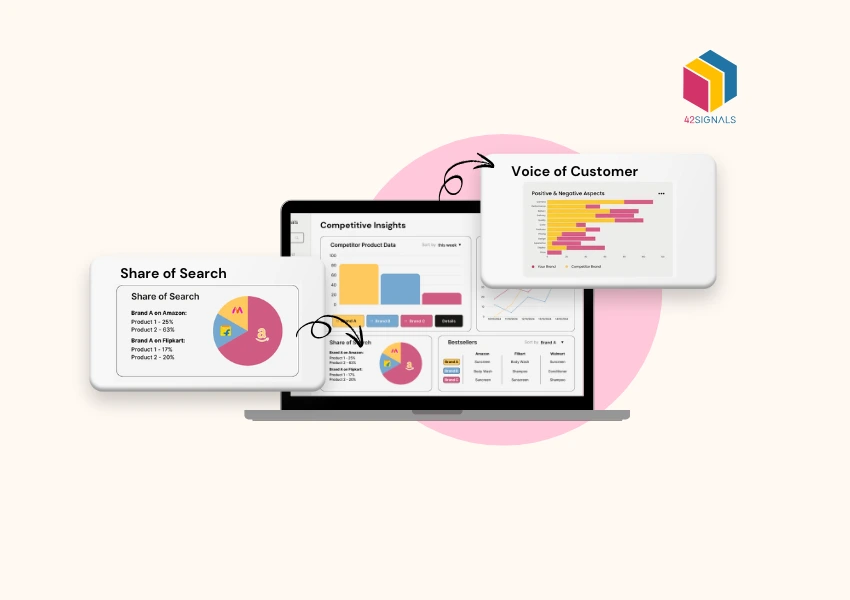
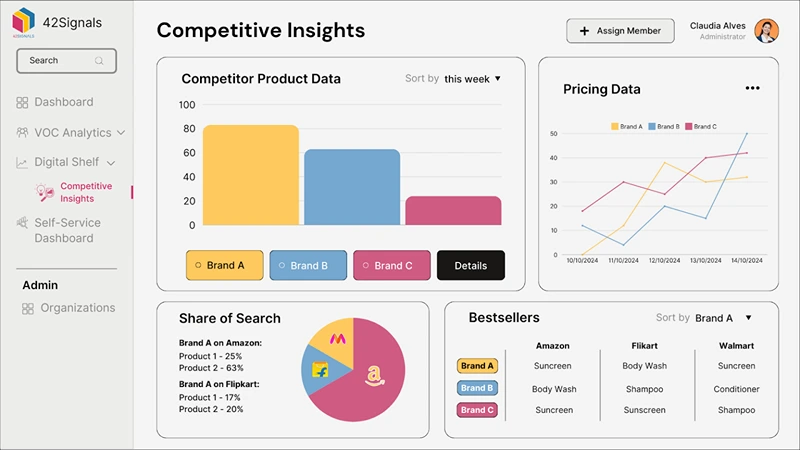
- Cross-Platform Integration: How do your products perform on Amazon? What are competitors doing on their websites? Such insights are easily available through a tool like 42Signals.
Pro Tip
Brands like Target use omnichannel insights to send personalized “We’re holding this for you!” emails when shoppers leave items in carts. Mimic this by choosing software that lets you act on data, not just stare at it. For instance, if a customer browses red sneakers on your app but doesn’t buy, trigger a push notification with a limited-time discount when they’re near your store.
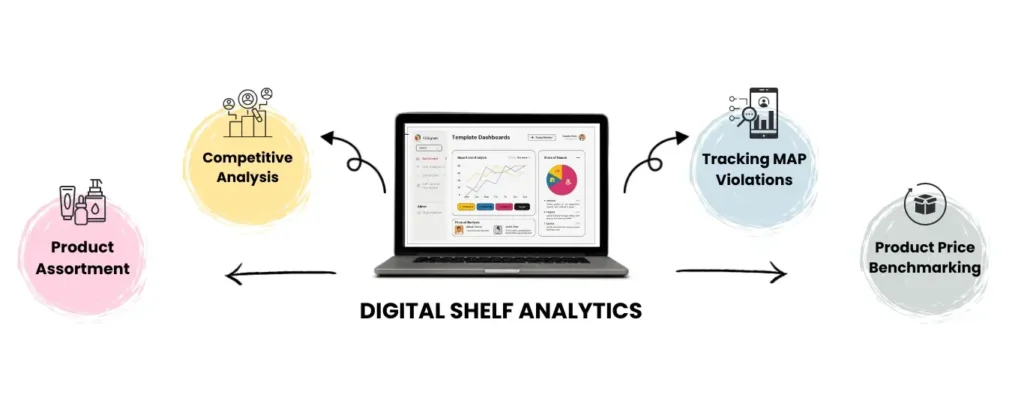
2. Digital Shelf Analytics: Win the Battle for Online Attention
Your product’s online listing is how the world views your brand. If your product title is buried under weak keywords on Amazon or your images look like they were taken with a flip phone, you’ve already lost. Digital shelf analytics tools (like 42Signals) act as your secret weapon, tracking:
- Search rankings: Are you on page 1 for “organic dog treats” or lost in page 5 purgatory?
- Pricing wars: Did Best Buy just undercut your TV price? Time to adjust.
- Review drama: A sudden spike in 1-star ratings? Investigate fast.
The Amazon Factor
Amazon’s algorithm prioritizes listings with clear titles, keyword-rich descriptions, and fast shipping times. Tools like 42Signals’ keyword ranking dashboard decode these requirements by showing which keywords competitors rank for and how often they update their listings.

For example, a pet food brand discovered that adding “grain-free” to their product title boosted their Amazon search ranking by 40% in a week.
Real-World Example
A skincare brand noticed its Amazon rankings dropped because competitors added video demos to their listings. They followed suit, filming a 30-second clip showing their moisturizer’s texture and absorption. Sales jumped 30% in a week, and they maintained their page 1 position. The takeaway? Choose a tool that flags these gaps before your revenue tanks.
Pricing Monitoring with a Retail Analytics Software
If Walmart drops the price of a coffee maker you sell, these retail analytics software tools automatically adjust your price to stay competitive, or alert you to match it manually if margins are tight. Price alert features enable timely notifications that prompt immediate action, rather than realising it days or weeks later.
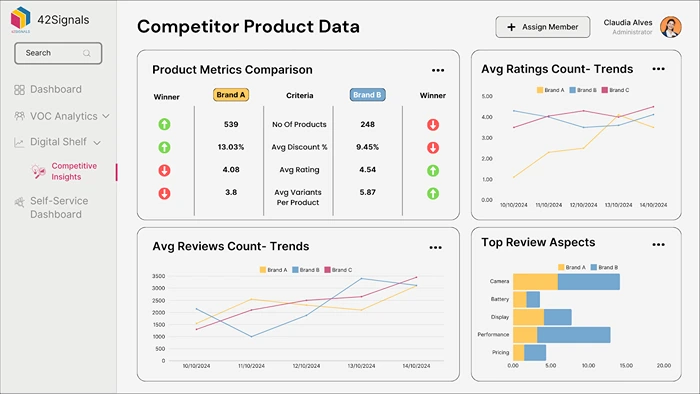
3. Competitor Dashboards with a Retail Analytics Software: Be the Sherlock Holmes of Retail
Imagine knowing your rival’s next move before they make it. A competitor analysis dashboard
lets you do just that. Track their pricing tricks, promo schedules, and even social media buzz.
For instance:
- If Competitor X slashes prices every Friday, counter with a Wednesday flash sale.
- If their “summer blowout” campaign starts June 1, launch yours May 25.
- If they’re out of stock on hiking boots, ramp up ads for your similar pair.
Beyond Basic Metrics
Most retail analytics software tools focus on price tracking, but the best dashboards go deeper:
- Social listening: Tools like Brandwatch or Mention scrape TikTok, Instagram, and Reddit to show what customers love (or hate) about competitors’ products.
- Return rate analysis: High return rates for a rival’s product? Highlight your item’s durability in ads.
- Email campaign spies: Services like Owletter archive competitors’ newsletters so you can dissect their promo strategies.
Case Study
A home decor brand used CompetitorIQ to discover that a rival’s “eco-friendly” messaging was resonating on Instagram. They revamped their own content to emphasize sustainability, using hashtags like #ZeroWasteLiving. Within a month, their engagement doubled, and sales rose 22%.
Watch Out For
Tools that only show basic price comparisons. The best dashboards dig deeper, like tracking competitors’ TikTok trends or analyzing returns data to spot quality issues.
4. Amazon Analytics: Crack the Code of the Giant with a Retail Analytics Software
Let’s face it: If you’re not on Amazon, you’re missing a massive audience. But Amazon’s ecosystem is a beast. To tame it, your software needs to track:
- Buy Box ownership: Losing this golden spot can crater sales. Tools like Helium 10 or Jungle Scout show why you lost it (e.g., slow shipping times) and how to win it back.
- Keyword performance: Are you ranking for “wireless headphones” or “Bluetooth earbuds”? Adjust your SEO strategy based on real searches.
- Review sentiment: If customers keep complaining about “battery life,” address it before your product gets delisted.
The Buy Box Battle
Winning the Buy Box—the coveted “Add to Cart” button on Amazon—can make or break sales. According to Feedvisor, 82% of Amazon sales go to the Buy Box winner. Tools like Informed.co monitor your eligibility by tracking:
- Shipping speed: Are you using Fulfillment by Amazon (FBA) or slower third-party logistics?
- Seller rating: Do you have a 95%+ feedback score?
- Price competitiveness: Is your product priced within 5% of the lowest offer?
Case in Point
A toy brand noticed its Buy Box win rate dropped to 40% during the holidays. Their analytics tool revealed that competitors were using FBA for faster shipping. They switched to FBA, offered a 10% holiday discount, and their Buy Box win rate bounced to 85% within two weeks.
Keyword Optimization
Amazon’s search algorithm rewards listings with precise keywords. Use tools like Semrush to identify high-volume, low-competition terms. For example, a kitchenware brand found that “non-stick ceramic pans” had 50% less competition than “non-stick pans” but similar search volume. By optimizing their titles and descriptions, they boosted conversions by 18%.
Watch Out For
Retail analytics software tools that provide timely and comprehensive data of the platform, along with proper insights on the category and competitor performances.
5. Picking the Right Tool: A No-BS Checklist for a Retail Analytics Software
- Start with pain points: Are you struggling with Amazon SEO? Losing sales to competitors? Fix the biggest fire first.
- Test integrations: If the tool doesn’t sync with Shopify or your POS system, keep looking.
- Demand transparency: Avoid vendors who hide costs behind “per user” fees. Ask about hidden charges for data storage or API access.
- Try before you buy: Most tools offer free trials. Use them to check for dealbreakers, like slow data refreshes or clunky interfaces.
- Talk to users: Reddit forums and G2 reviews reveal the truth. One retailer told me Vendasta’s pricing was a “black hole,” while others swore by Skai’s Amazon insights.
Implementation Tips
- Train your team: Even the best retail analytics software is useless if your staff doesn’t understand it. Schedule workshops with the vendor.
- Set KPIs: Are you aiming for a 20% increase in Amazon rankings? A 15% reduction in cart abandonment? Define success upfront.
- Audit quarterly: Retail trends change fast. Re-evaluate your tool’s performance every 3–6 months.
Cost Considerations with a Retail Analytics Software
- Small businesses: Tools like Prisync (starting at $99/month) offer basic price tracking.
- Mid-market: Profitero ($1,000+/month) includes digital shelf analytics and competitor monitoring.
- Enterprise: 42Signals (custom pricing) bundles all platform insights (Amazon, Walmart, Quick Commerce, Native Websites) with your needs in different formats.
6. Future-Proofing Your Strategy
Retail analytics software isn’t a “set it and forget it” investment. Stay ahead with these trends:
- AI-powered predictions: Tools like Blue Yonder use machine learning to forecast demand spikes, like predicting umbrella sales before a storm.
- Voice commerce analytics: As more shoppers use Alexa or Google Home, track how voice searches impact your rankings (e.g., “Alexa, buy organic coffee”).
- Sustainability metrics: Consumers demand eco-friendly practices. Tools like EcoCart analyze how shipping delays or packaging choices affect your brand’s carbon footprint and sales.
Final Thoughts on Picking Your Retail Analytics Software
The right analytics retail analytics software shouldn’t just report numbers; it should help you solve challenges. The above steps and processes will help you align your needs with the software available in the market.
Schedule a demo today to see how 42Signals can align with your needs.
Frequently Asked Questions on Retail Analytics Software
1. What is retail analytics?
Retail analytics is the process of collecting, analyzing, and interpreting data from retail operations to make smarter business decisions. It involves tracking customer behavior, product performance, sales patterns, and operational metrics across physical stores and online platforms.
With retail analytics, businesses can:
- Understand what products are selling and why.
- Optimize pricing and promotions.
- Manage inventory more efficiently.
- Personalize customer experiences.
- Improve supply chain and merchandising strategies.
For example, a retailer may analyze POS (Point of Sale) and website traffic data to identify best-selling SKUs and predict seasonal demand.
2. Which software is best for retail?
The best retail analytics software depends on the size of the business, data maturity, and specific use cases. However, some widely used and trusted solutions include:
- Tableau – Excellent for visualizing store performance, sales trends, and customer behavior.
- Power BI – A popular tool for businesses wanting customizable dashboards and strong integrations.
- Google Looker (Looker Studio) – Ideal for e-commerce and omnichannel reporting.
- 42Signals – A specialized retail analytics and price intelligence platform for competitive monitoring and market visibility.
- SAP Retail Analytics – Best suited for large enterprises with complex supply chains.
These tools help retailers combine multiple data streams into actionable insights, enabling faster and more accurate decision-making.
3. What is the best analytics software?
There isn’t a single “best” analytics software universally—it depends on business needs.
- For visualization and reporting: Tableau and Power BI lead the market.
- For marketing and customer data: Google Analytics and Adobe Analytics are common choices.
- For competitive and pricing insights: Tools like 42Signals provide real-time market intelligence.
- For end-to-end enterprise intelligence: SAP, Oracle, and IBM Cognos are strong options.
The ideal software often integrates with CRM, ERP, and POS systems to create a unified data view.
4. What are the various applications in retail analytics?
Retail analytics can be applied across multiple functions, including:
- Sales & Revenue Optimization
Identifying high-performing products, profitable segments, and slow-moving stock. - Inventory & Supply Chain Management
Predicting demand, reducing stockouts, and optimizing replenishment cycles. - Customer Experience & Personalization
Analyzing shopping behavior to offer targeted recommendations and improve retention. - Pricing & Promotion Strategy
Using real-time data to set competitive prices, detect MAP violations, and measure campaign effectiveness. - Store & Channel Performance Tracking
Measuring performance across different stores, regions, and online channels to allocate resources efficiently. - Market & Competitor Intelligence
Monitoring competitor pricing, assortment, and promotions to maintain an edge in the market.


