** TL;DR ** Top brands dominate the digital retail landscape by leveraging shelf analytics—a method for methodically tracking product performance on e-commerce sites, which act as the “digital shelf.” This data-driven approach focuses on four core pillars: Availability (In-Stock Rate and Content Compliance), Visibility (Keyword Ranking and Share of Search), Pricing (monitoring against competitors and detecting MAP violations), and Reviews (average star rating and velocity). By using a centralized Shelf Analytics Dashboard as a KPI tracker, these companies move beyond simple sales reporting to achieve real-time, proactive optimization, integrating insights into their daily workflows to ensure their products are always visible, correctly priced, compliant, and ready for purchase, ultimately turning data into a significant competitive edge.
Have you ever wondered how the biggest names in retail and consumer goods always seem to be steps ahead? It’s not magic; it’s methodical tracking and smart data use. In today’s hyper-competitive online world, your product’s visibility on an ecommerce site is just as important—if not more so—than its placement in a physical store. This is where the power of shelf analytics comes into play.
If your brand is selling online, you’re competing for prime real estate on countless digital storefronts. Understanding exactly how your products are performing across these sites is no longer optional; it’s the bedrock of sustained success. We’re going to pull back the curtain on the strategies top brands use and, better yet, give you a proven framework—our Shelf Analytics Dashboard Overview —to start seeing everything clearly in one place.
The Digital Shelf: Your New Battleground & The Need for Shelf Analytics
Think of a bustling physical grocery store. Brands fight for eye-level placement, endcaps, and high-traffic areas. The digital shelf is the equivalent of that store aisle, but infinitely more complex and dynamic. It encompasses everything that influences a customer’s decision, from the search results page to the product detail page, and everything in between.

Image Source: Dataweave
Top brands recognized this shift early. They understood that simply being listed was not enough. They needed granular data on how their products appeared, how they ranked, and how compliant their product listings were across major retailers like Amazon, Walmart, and Target. This need drove the development of robust tools focused on digital shelf analytics. Without this deep-dive data, your brand is essentially operating blind, guessing what works and what doesn’t. You need actionable ecommerce insights to move the needle.
Why the Digital Shelf Requires a Different Kind of Focus
The traditional retail model allowed for quarterly check-ins with sales teams and merchandising reviews. The digital world moves in minutes, not months. A competitor’s price change, a sudden drop in your keyword ranking, or a technical error on a retailer’s site can instantly erase sales.

Digital shelf analytics offers real-time or near real-time visibility into these fluctuating conditions.
- It helps you answer critical questions: Are my products in stock?
- Are they priced correctly?
- Is my brand showing up when customers search for relevant terms?
Top brands use this data to pivot strategies daily, ensuring they maximize every opportunity to convert a browsing customer into a buyer. This proactive approach is the core difference between a brand that dominates and one that simply exists.
The Core Pillars of Shelf Analytics: What Top Brands Measure
When top brands invest in shelf analytics, they aren’t just looking at sales numbers. They are examining the underlying drivers of those sales, which fall into four main categories. Understanding these categories is the first step toward building an effective KPI tracker for your own operations.
1. Availability and Content Compliance
This pillar is all about the fundamentals. If a customer can’t buy your product, all other marketing efforts are wasted. Top brands constantly monitor two key metrics here: In-Stock Rate and Content Accuracy.
- In-Stock Rate (or Out-of-Stock Tracking): This metric tracks the percentage of time your product is available for immediate purchase across all monitored retailers. A major beverage brand, for example, might find that a high-volume retailer frequently runs out of its most popular SKU on weekends. This specific digital shelf data allows the brand to work directly with the retailer on forecasting and inventory adjustments, preventing lost revenue.

42Signals’ product availability feature
- Content Accuracy and Compliance: This checks if your product title, description, images, and A+ content meet your brand standards and the retailer’s requirements. A leading electronics company uses shelf analytics to detect map violations—Minimum Advertised Price—or incorrect product specifications instantaneously. If a product description is missing a key feature or uses an outdated image, it directly impacts conversion rates. Maintaining perfect content compliance ensures your product is always presented optimally.
2. Visibility and Search Performance
If a product is in stock but nobody can find it, it still won’t sell. Visibility is measured through search rank and share of search. Top brands obsess over both.
- Keyword Ranking and Search Position: This tracks where your products appear in search results for high-value keywords. For a beauty brand, monitoring its keyword ranking for terms like “organic facial cleanser” on Amazon is a daily task. Falling from position one to position five can mean a massive drop in traffic and sales. Shelf analytics provides the granular detail needed to see which keywords are slipping and which competitors are gaining ground.
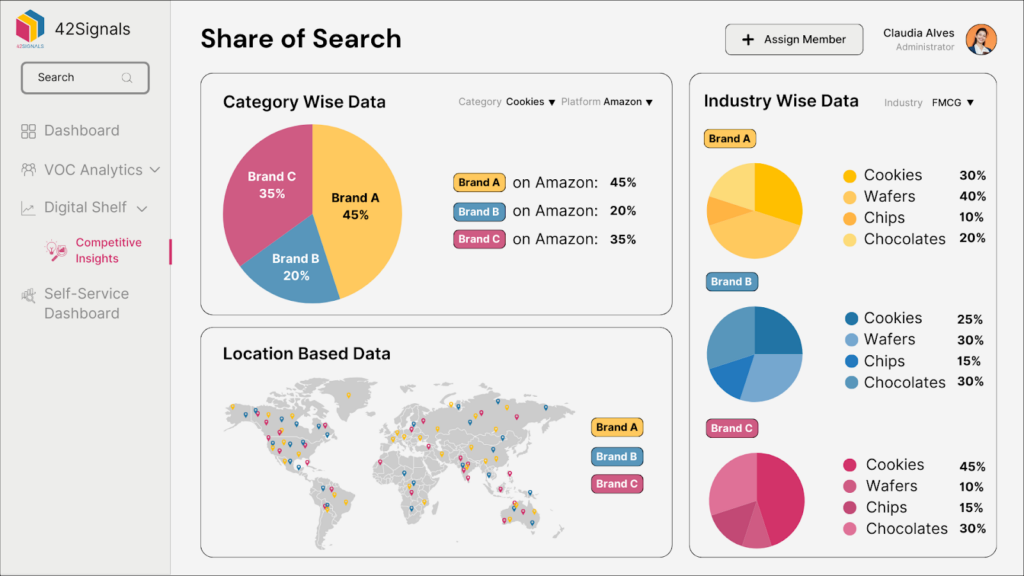
- Share of Search: This metric measures your brand’s presence relative to your competitors across key search terms. If “protein powder” is searched 100 times, and your brand’s products appear in the top ten results 30 times, your share of search is 30%. Top performers aim to increase this share by identifying terms where they are underperforming. It’s a direct indicator of brand dominance in the digital aisle.
3. Pricing and Promotions
Price is often the single biggest factor in an online purchase. Effective ecommerce reporting tracks competitive pricing in real-time.
- Price Monitoring and MAP Violations: Brands track their product prices against their competitors and, crucially, against their own set Minimum Advertised Price (MAP). Detecting MAP violations is a core function of shelf analytics. A premium footwear brand, for instance, might detect that a third-party seller is undercutting its price on Walmart, which can devalue the brand. Automated alerts allow the brand to take immediate corrective action.

- Promotional Effectiveness: Tracking the duration, nature (e.g., percentage off, coupon), and impact of promotions across various retailers allows brands to determine their true ROI. They use the data to see if a price drop boosted search rank and conversion enough to offset the lower margin.
4. Reviews and Ratings
Customer feedback is the social proof that drives conversion. High ratings and a large volume of recent reviews are non-negotiable for success on the digital shelf.
Image Source: Consumer sentiment by 42Signals
- Average Star Rating and Review Volume: Brands track their average rating compared to competitors. They also monitor the velocity of new reviews. A sustained drop in the average star rating, or a sudden flood of negative reviews related to a specific product flaw, can be flagged immediately through digital shelf data. This allows the quality or customer service teams to respond proactively, often before the issue escalates. A consumer packaged goods company might use this data to identify regional quality issues based on review sentiment.
Beyond the Basics: Advanced Ecommerce Insights
While the core pillars provide the foundation, top brands don’t stop there. They layer on more sophisticated ecommerce insights that connect the dots between the digital shelf and the broader marketing strategy.
Connecting the Dots: Marketing Spend and Shelf Performance
Smart brands don’t look at advertising and shelf analytics in silos. They use their ecommerce reporting to connect paid media spending directly to shelf performance metrics. For example, if a brand increases its spend on Google Shopping ads targeting a specific product, they immediately track the resulting lift in that product’s search rank and sales velocity on the target retailer site. This granular view allows for precise optimization of advertising budgets. If the advertising cost is high but the search rank remains stagnant, the brand knows the ad targeting or the product listing content needs immediate refinement.
The Rise of Market Basket Analysis
Another advanced technique involves using digital shelf data to perform virtual “market basket analysis.” This looks at what products customers buy alongside yours. While this data is often proprietary to the retailer, leading brands use syndicated data and analytics tools to infer adjacent purchases. This helps them identify bundling opportunities, cross-promotion strategies, and even new product development ideas. If customers frequently buy product X with a competitor’s product Y, the brand knows there’s a missing link in their own portfolio.
Get Our Proven Shelf Analytics Dashboard
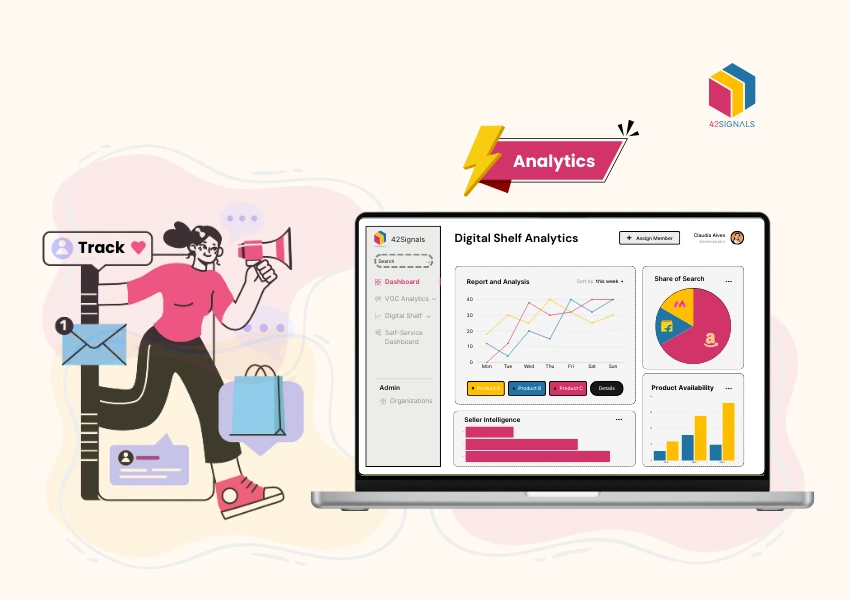
Seeing all this information in disparate spreadsheets and reports is overwhelming. The secret weapon of top-performing brands is the centralized, visual dashboard. This is where you bring all the streams of digital shelf data together for easy interpretation and rapid decision-making.

We’ve designed a powerful framework to help you organize this complex data—our Shelf Analytics Dashboard. This dashboard is designed to function as your central KPI tracker, organizing your key metrics into actionable views.
Key Components of the Dashboard (An Example)
This is an example of a dashboard (metrics can be customized to your needs) that organizes data into clear, easy-to-read sections, ensuring you maintain a focus on critical metrics without getting bogged down in noise.
1. Executive Summary and Health Score
This section provides a high-level, instantaneous view of your brand’s overall digital shelf health.
- Digital Shelf Health Score: This is a weighted average of your core metrics (Availability, Rank, Price, Reviews) converted into a single, easy-to-understand score (e.g., 85/100). A drop below a certain threshold triggers an alert.
- Trend Analysis: Simple charts showing week-over-week or month-over-month trends for net sales and overall keyword ranking improvement. This allows executives to quickly gauge performance without needing to dig into the details.
2. Deep Dive: The Four Pillars
Each of the four main pillars of shelf analytics gets its own dedicated view, allowing analysts to quickly pinpoint problems.
| KPI Category | Key Metrics Tracked | Actionable Insight |
|---|---|---|
| Availability | In-Stock Products by Retailer, Out-of-Stock Instances in Dark Stores | Identify immediate inventory gaps and forecast errors. |
| Visibility | Average Search Position (Top 10 Keywords), Share of Search | Prioritize content optimization or advertising spend for underperforming keywords. |
| Pricing | Competitor Price Comparison, MAP Violations Detected | Alert sales and compliance teams to unauthorized price drops or pricing errors. |
| Content/Reviews | Average Star Rating, Review Velocity, Positive and Negative Sentiment Understanding | Flag product pages needing immediate updates or customer service intervention. |
3. Competitive Landscape Tracker
You cannot win if you don’t know what the competition is doing. The dashboard includes a section dedicated to tracking competitors’ performance using key shelf analytics metrics. This allows you to visually compare your share of search and price index against your top three rivals, giving you the context needed to understand your performance—you might be doing better than last month, but still losing ground to a competitor.
4. The Compliance Monitor
This specialized section focuses specifically on compliance issues like product data accuracy and MAP violations. It features a rolling list of detected violations, the retailer involved, the product SKU, and the status of resolution. For a large brand with thousands of products across dozens of retailers, this acts as a crucial audit log, ensuring legal and pricing integrity is maintained globally.
Integrating Shelf Analytics into Your Workflow
A dashboard is only as useful as the actions it inspires. Top brands don’t just look at digital shelf data; they integrate the insights into their daily and weekly operating rhythms.
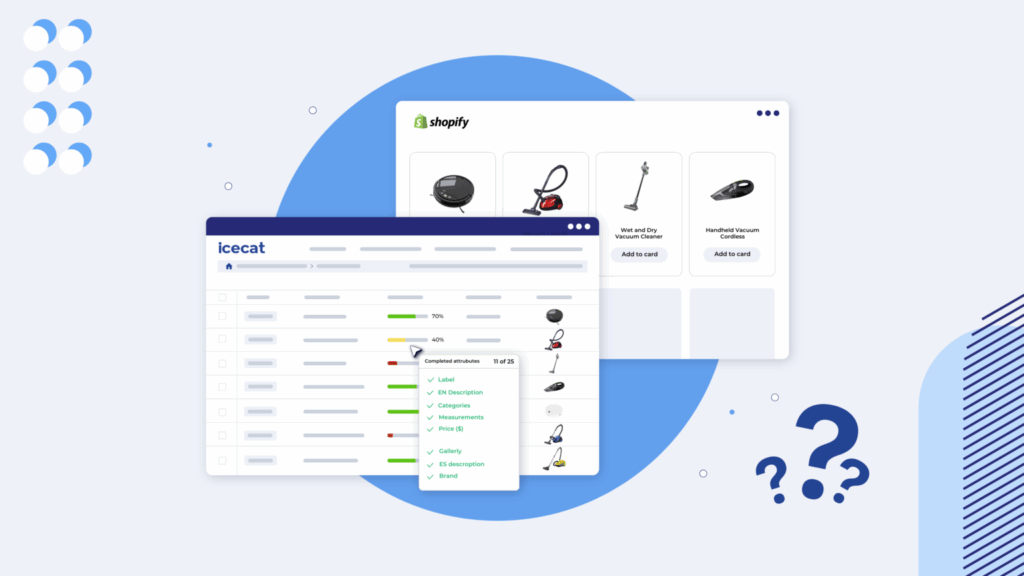
Image Source: Ice Cat
Daily Triage and Rapid Response
Teams responsible for ecommerce reporting check the dashboard daily for high-priority alerts. If a critical product’s In-Stock Rate drops below 95% on a key retailer, or if a significant MAP violation is detected, the relevant team (supply chain or sales) is notified immediately. This rapid response minimizes revenue loss. For example, a sudden drop in keyword ranking might trigger an immediate campaign to optimize the product title and boost internal search ad spend to recover the lost ground within hours, not days.
Weekly Strategic Deep Dives
Once a week, leadership and marketing teams review the overall trends revealed by the shelf analytics. They look beyond the daily fixes to identify systemic issues.
- Content Strategy Review: If the dashboard shows consistently low search visibility for a category, the content team is tasked with rewriting product descriptions based on identified high-volume, low-ranking keywords.
- Promotional Planning: If a competitor gains a large spike in share of search immediately following a promotion, the brand uses that ecommerce insight to schedule a strategically timed counter-promotion or adjust their next pricing event. They use the data to understand the optimal duration and depth of discounts.
The Human Element: Simple Words for Complex Data
One of the biggest challenges with advanced data platforms is making the information accessible to everyone. Top brands understand that complex data needs to be translated into simple, conversational language for the marketing, sales, and supply chain teams who use it every day. The goal of effective shelf analytics is clarity, not complexity.
For instance, instead of reporting a “7.2% decline in SKU X’s weighted average search index over the prior 7 days due to a competitive displacement event,” the dashboard summarizes it as: “Product X is losing visibility for top searches. Competitor Z is outranking us.” This clear, straightforward language ensures that the person responsible for fixing the issue understands the problem instantly and can take immediate action.
By adopting a simple language approach in your ecommerce reporting, you reduce the friction between the data and the decision-maker. This is a critical component of achieving human-like efficiency, where insights are immediately grasped and acted upon, rather than requiring several layers of interpretation.
Turning Digital Shelf Data into a Competitive Edge
The digital shelf is the future of retail, and shelf analytics is the engine that drives success within it. Top brands don’t wait for sales reports; they proactively manage the drivers of those sales—availability, visibility, pricing, and reputation. By utilizing robust tools that capture granular digital shelf data, they ensure that their products are always ready to be found and purchased.
Implementing a centralized KPI tracker, like our Shelf Analytics Dashboard, moves you away from reactionary decision-making toward a strategy of continuous optimization. It allows you to swiftly detect MAP violations, track your crucial keyword ranking improvements, and continuously increase your share of search.
Try 42Signals to understand how our dashboard and data can help you understand digital shelf performances quickly.
Frequently Asked Questions
1. What is shelf analytics?
Shelf analytics is the practice of measuring how products perform on a shelf—either physical or digital—by analyzing visibility, placement, availability, and sales impact. In physical retail, it looks at shelf placement, facings, and stock levels. In digital commerce, it focuses on search ranking, product placement, pricing, and stock availability.
Shelf analytics helps businesses understand which products attract attention, which ones sell consistently, and where shelf space is being underutilized.
2. What is shelf strategy?
A shelf strategy is a planned approach to deciding which products go on the shelf, where they are placed, and how much space they receive. The goal is to maximize sales, visibility, and profitability.
A strong shelf strategy considers:
Customer shopping behavior
Product demand and margins
Category roles and priorities
Seasonal trends and promotions
Competitive placement
In digital retail, shelf strategy also includes search ranking tactics and digital shelf optimization.
3. What is shelf technology?
Shelf technology refers to the tools and systems used to monitor, manage, and optimize shelf performance. In physical stores, this includes electronic shelf labels, smart sensors, and image recognition cameras. In e-commerce, shelf technology includes digital shelf analytics platforms, pricing intelligence tools, and inventory monitoring systems.
Shelf technology enables real-time visibility, faster decision-making, and more accurate shelf execution.
4. What is shelf intelligence?
Shelf intelligence is the actionable insight generated from shelf data. It combines analytics, automation, and market signals to help brands and retailers understand how products compete for attention and sales.
Shelf intelligence answers questions like:
Why is a product losing visibility?
Which competitor is gaining shelf space?
How do pricing or stock changes affect performance?
Where should shelf investments be focused?
It turns raw shelf data into decisions that drive growth and efficiency.