The global fast fashion industry operates at a velocity unmatched in retail. Weekly revolutions in patterns, fits, colours, and garment structures – particularly in high-rotation categories like dresses and t-shirts – create relentless pressure, and that’s where product insights matter.
For one of India’s largest fashion powerhouses (operating a portfolio including a wildly popular value brand and a premium lifestyle label), intuition was no longer enough. Traditional methods couldn’t decode the chaotic signals emanating from the digital shelf across platforms like Amazon, Myntra, and their own D2C sites.
Their challenge was existential: How to transform overwhelming online retail data into actionable intelligence for product development, inventory planning, marketing, and pricing?
The solution, Digital Shelf Analytics (DSA), became their strategic compass, driving a 34% sales uplift in core categories within six months.
The Need for Product Insights – Cost of Flying Blind
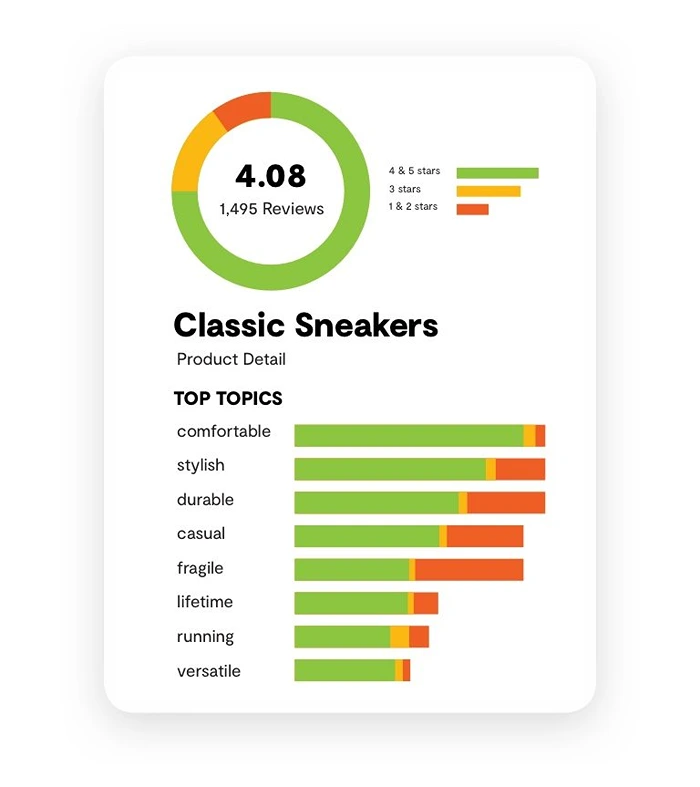
Image Source: Power Reviews
The Problem: Legacy Systems Hitting Their Limits
Let’s call this brand Moda. The brand relied on a fragmented approach, working with lagging data –
- Manual Competitive Tracking: Teams spent hundreds of hours weekly manually checking competitor websites and Amazon data for product data and prices, new launches, and promotions. This was prone to errors and missed crucial nuances like fleeting banner placements.
- Delayed Sales Signals: Internal sales data took 30-45 days to consolidate and analyze, rendering it useless for reacting to fast-moving trends. By the time a “viral” t-shirt shape was identified internally, competitors had saturated the market.
- Gut-Driven Design & Assortment: Decisions on colours, fits, and category prioritization were often based on historical performance or designer intuition, failing to capture real-time shifts in consumer preference amplified by social media.
- Siloed Digital Shelf View: There was no unified view comparing their own digital shelf performance (on their sites and marketplaces) against key competitors. They couldn’t systematically answer: Why is Competitor X’s ‘Floral Maxi Dress’ outselling ours on Amazon? What tags are they using? Where is it placed?
- Ineffective Discounting & Clearance: Discount strategies were often reactive and blanket, leading to deep margin erosion on items that might have sold with better initial placement or minor tweaks, while truly stagnant inventory wasn’t identified early enough
Concrete Consequences:
- Overproduction of Unpopular Items: Significant fabric and production capacity was tied up in items destined for discount bins (e.g., a specific high-neck ruffle detail on blouses consistently underperformed but wasn’t flagged early).
- Missed Trend Windows: Failing to spot the rapid ascent of “balloon sleeves” in tops until it was peaking, resulting in late entry and lost market share.
- Inconsistent & Suboptimal Category Hierarchies: Analysis revealed that their value brand’s website buried “Party Wear” under three sub-menus, while a key competitor had it as a top-level category during festival season, capturing significantly more traffic.
- Ineffective Promotions: Deep discounts (50%+) were applied across entire categories during end-of-season sales, including items that were still selling well at 30% off, unnecessarily sacrificing margin.
- The Holi Catalyst: A meticulously planned “Holi Festival Collection” underperformed by 22% year-on-year in 2023. Post-mortem analysis, delayed by data lag, suggested a mismatch between the promoted vibrant synthetics and a consumer shift towards breathable, washable cotton whites and pastels – a trend visible on competitors’ digital shelves weeks earlier.
- The Imperative: Leadership mandated a data revolution with product insights. They needed a unified, real-time view encompassing product data and prices, critical Amazon data, granular digital shelf metrics (visibility, placement, tags), and competitor activity transformed into a proactive decision-making engine.
The 42Signals Solution – Architecting a Digital Shelf Nerve Center

Why 42Signals?
Moda partnered with 42Signals for its speed, scale, shelf data, and security. Some of the key capabilities provided were –
1. Real-Time Competitive Intelligence Engine:
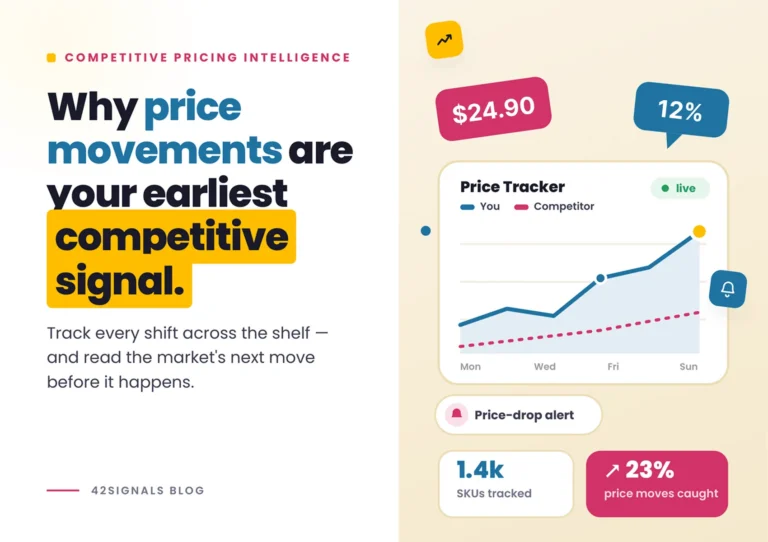
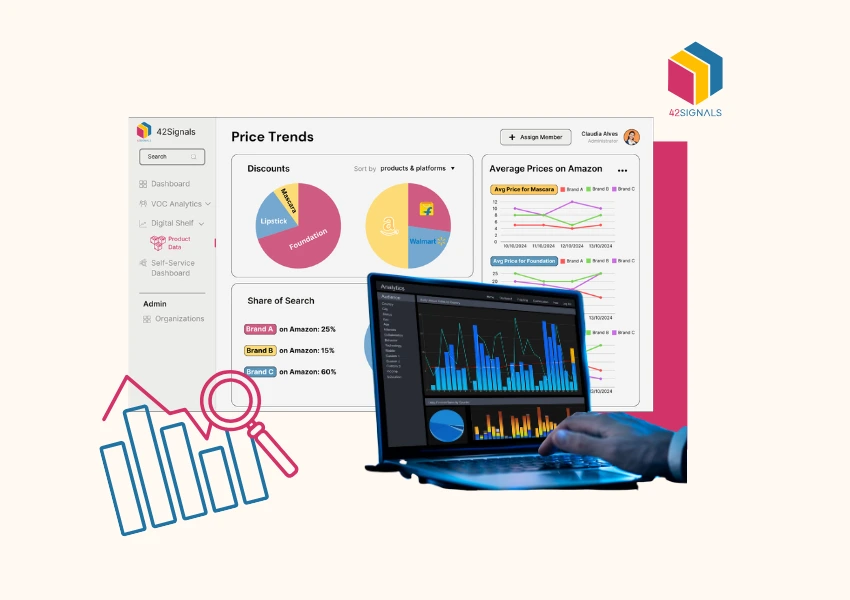
- Granular Product & Price Tracking: Continuously monitored product data and prices across 12+ key competitors (including Amazon, Myntra, Ajio, Flipkart Fashion, and competitors’ D2C sites) at the SKU level. Tracked not just current price, but price history, discount depth, and discount duration.
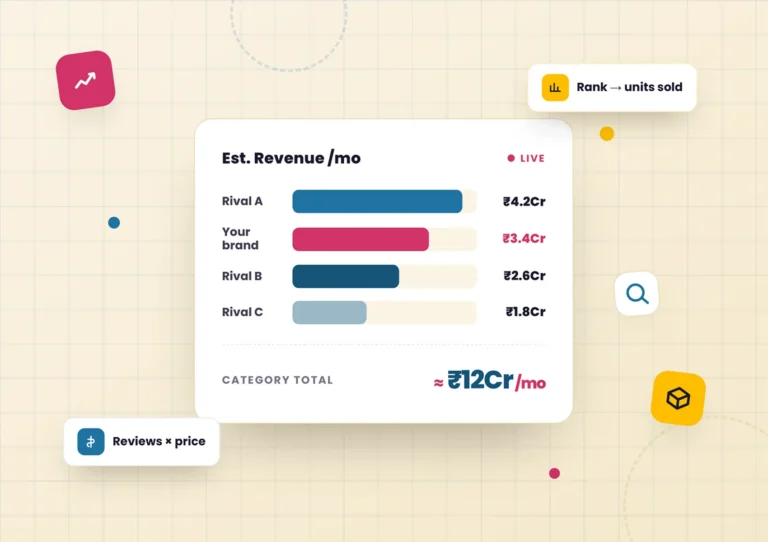
- Amazon Data Integration: Specialized scraping and API integration for Amazon data, crucial due to its massive market share. Tracked Best Seller Ranks (BSR), new arrivals velocity, review sentiment analysis, and Buy Box ownership dynamics.
- Dynamic Category Hierarchy Mapping: Automated daily mapping of category trees across all tracked sites. Identified shifts like “Oversized T-shirts” moving from a sub-sub-category to a prominent top-level “Trending Now” section on Myntra within a week. Tracked the ranking of categories (e.g., “Dresses > Casual > Midi” vs. “Dresses > Party > Mini” prevalence).
- Banner & Promotional Spot Analysis: Used image recognition and text analysis to identify exactly which products were featured in homepage banners, carousels, and promotional headers (“Festive Launch,” “Summer Must-Haves”). Quantified share-of-voice for specific attributes (e.g., “70% of competitor banners featured Floral Dresses in Week 22”).
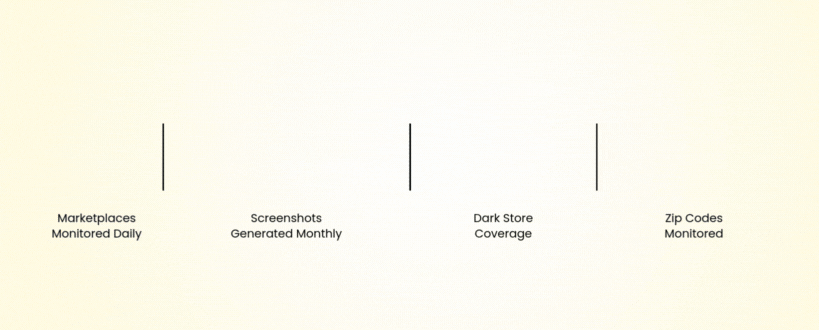
- Dark Store Monitoring (Pilot): Began tracking inventory availability and assortment changes in competitor “dark stores” (micro-warehouses) identified near their value brand’s high-density store clusters, aiming to understand hyper-local demand and 10-minute delivery assortment strategies.

Image Source: Zepto Data
2. Deep Attribute & Tag Intelligence:
- Digital Shelf Metric Extraction: Systematically scraped and categorized digital shelf metrics like product tags (bestseller, fast-moving, viral, trending, sustainably sourced, limited stock, new arrival) and badges (“#1 Best Seller,” “Only 2 Left!”).
- Attribute Velocity Analysis: Tracked the rise and fall of specific attributes (colour: “Lime Green,” fit: “Relaxed,” sleeve: “Balloon,” neckline: “Asymmetric,” fabric: “Linen Blend”) across categories. Generated heatmaps showing attribute popularity over time and by region.
- Occasion & Festival Filtering: Automated classification of products into occasion-based clusters (Beachwear, Party Wear, Work Wear, Athleisure) and festival-specific collections (Holi, Diwali, Summer Festivals). Monitored search volume and placement intensity for these clusters.
3. Trend Sourcing & Forecasting Engine:
- Global Trend Radar: Scanned key Western fast fashion retailers (ASOS, Zara, H&M global sites) and trend aggregators for emerging styles, colours, shapes, and details (e.g., “Balletcore,” “Gorpcore,” “Cowboy Boot Revival”). Prioritized items with high velocity and positive sentiment for potential adaptation.
- Attribute Clustering for Product Dev: Combined velocity data from tags (viral, bestseller), attributes (colour, fit), and occasion (Party Wear) to identify high-potential hybrid concepts (e.g., “Holi Party Dresses in Viral Pastels with Sustainable Cotton”).
- Discount & Clearance Analytics: Precisely tracked which products went on sale, how deep the discounts were, how long items lingered in the “Sale” section, and ultimately, which items were removed entirely. This identified true slow-movers versus items cleared for new season stock.
4. Assortment & Stock Visibility:
- “Fully In Stock” Monitoring: Tracked the percentage of items in key categories/new collections that remained in stock (all sizes/colours) as an indicator of demand forecasting accuracy and production agility. Also provided inventory alerts.
- New Launch Tracking: Monitored the velocity and initial reception of new category launches and sub-brands by competitors.
The Implementation of Product Insights with 42Signals
Phase 1: Decoding the Competitive Landscape (Weeks 1-4)
The 42Signals platform ingested millions of data points daily. The initial focus was on answering foundational questions using Amazon data and broader digital shelf analytics.
- What’s Trending NOW? Identified “Athleisure Jumpsuits” spiking 45% in search volume and sales rank across platforms in Q1, driven by social media (#athleisurestyle). Attribute Insight: Key was “wide leg” and “terry cotton.”
- Who Owns Key Categories? Revealed Competitor X dominated “Work Wear Blazers” not just through product, but via persistent homepage banner placement during weekdays and high officewear tag usage. Digital Shelf Metric Insight: Their premium brand had comparable products but lower visibility.
- What’s Failing? Analysis showed 80% of heavily discounted “Ruffled Sarees” across competitors had been in the “Sale” section for >60 days, indicating a broader market saturation beyond their own Holi woes. Price Insight: Deep discounts (60%+) started too late to clear stock effectively.
Action Taken with Product Insights:
- Immediate reallocation of 30% of fabric earmarked for ruffled details to jumpsuit production for Moda.
- Their premium brand under Moda initiated a “Work Wear Revamp” project, prioritizing blazers and tailoring, with instructions to marketing to secure prime homepage banner slots on their D2C site.
Phase 2: Optimizing the Owned Digital Shelf (Weeks 5-8)
Insights turned inward to optimize their own e-commerce presence:
- Category Hierarchy Restructuring: Data revealed Moda competitors were succeeding by making “Sustainably Sourced” a top-level navigation category, not just a filter buried in “Facets.” Their value brand had “New Arrivals” and “Offers” as top-level, but sustainability was hidden. Action: Added “Eco-Conscious” as a main menu item on both brand sites, with clear tagging. Result: Category traffic grew 27% within a month; sales of tagged items increased disproportionately.
- Banner & Promotion Strategy: Analysis showed products featured in >50% of competitor banners (e.g., “Wide-Leg Jeans”) had significantly higher sell-through. Action: Implemented a data-driven banner rotation plan for their value brand’s site, prioritizing items identified as high-potential via DSA (strong tags, rising attributes, competitor success). Reserved prime homepage real estate for items needing a velocity boost, not just new launches. Result: Click-through rate (CTR) on banners increased by 18%.
- Tag & Badge Optimization: Audited their own product tagging against scraped digital shelf metrics from competitors. Found underutilization of fast-moving and viral tags. Action: Implemented rules-based auto-tagging based on sales velocity and social mentions. Added “Almost Gone!” badges for items with low stock across sizes. Result: Conversion Rate (CVR) increased by 8% on tagged items.
Phase 3: Revolutionizing Product Development & Merchandising (Ongoing)
DSA became embedded in the core product development process:
- Attribute-Driven Design Briefs: Designers from Moda received weekly reports highlighting surging attributes (colour: Sage Green, fit: Relaxed, detail: Crochet Trim, sleeve: Puff). Briefs explicitly referenced combinations showing high velocity (e.g., “Relaxed Linen Shirt in Sage”).
- Western Trend Localization: The platform flagged “Cottagecore Dresses”, gaining rapid traction on ASOS and Zara EU. Action: Their premium brand’s PD team adapted the trend using lighter Indian cottons and shorter hemlines suitable for warmer climates, launching a “Garden Escape” mini-collection within 8 weeks. Tracked meticulously via DSA upon launch.
- Occasion & Festival Planning: Data from occasion-based filtering (Beachwear spiking in coastal city-targeted ads) and festival-based filtering (clear preference for White Cotton Kurtas pre-Holi over synthetics) directly informed capsule collection planning and regional inventory allocation.
- Pricing Strategy Refinement: Continuous monitoring of product data and prices allowed for dynamic pricing. They could position new items competitively based on real-time competitor pricing for similar attribute bundles and adjust promotions based on observed competitor discounting patterns.
Measurable Impact with Product Insights

- Sales Uplift: 34% increase in sales for categories where DSA insights directly drove assortment decisions (e.g., Women’s Dresses, Men’s Casual Tops). Overall, Moda’s revenue growth accelerated significantly.
- Margin Protection: 18% reduction in average discount depth required to clear slow-moving inventory, achieved by identifying stagnation signals earlier and adjusting production/promotions proactively.
- Speed-to-Market: 12% faster trend-to-shelf speed for identified viral items (e.g., “Barbiecore Pink” items launched in sync with the movie buzz, capitalizing on peak demand).
- Traffic & Conversion: 27% increase in traffic to the newly created “Eco-Conscious” category landing page. 8% uplift in Conversion Rate (CVR) on products tagged with bestseller, fast-moving, or low-stock badges.
- Marketing Efficiency: 18% increase in Click-Through Rate (CTR) on homepage banners driven by data-informed product selection and placement timing.
- Inventory Health: Reduction in end-of-season discount stock by ~15% due to better early identification of slow-movers and production adjustments.
- Competitive Positioning: Improved share-of-voice for key trend categories during critical launch periods (e.g., matching competitor banner intensity for “Festive Wear”)
Qualitative Shifts using 42Signals
- Proactive vs. Reactive: Teams shifted from post-mortem analysis to proactive opportunity spotting and threat mitigation.
- Data-Driven Culture: “What does the data say?” became a common refrain in PD, Merchandising, and Marketing meetings, reducing subjective debates.
- Cross-Functional Alignment: The single source of truth (the dashboard and deck) fostered alignment between design, buying, planning, marketing, and e-commerce teams.
- Confidence in Innovation: Product insights provided a safety net for experimenting with adapted Western trends or new attribute combinations.
Why Every Fashion Brand Needs Digital Shelf Product Insights
Moda, the leading fashion conglomerate’s journey, underscores a fundamental shift: the digital shelf is no longer just a sales channel; it’s the richest, real-time source of market intelligence available.
The results – a 34% sales surge, faster innovation, sharper pricing, and reduced discount dependency – prove the power of data-driven agility in fast fashion.
The Lesson for All Retailers: In an era defined by fleeting trends and hyper-competition, the winners won’t just have a presence on the digital shelf; they will possess the analytical prowess to decode it, dominate it, and leverage it as the ultimate strategic asset for product development, marketing, and sustainable growth.
Sign up for a free trial with 42Signals.