
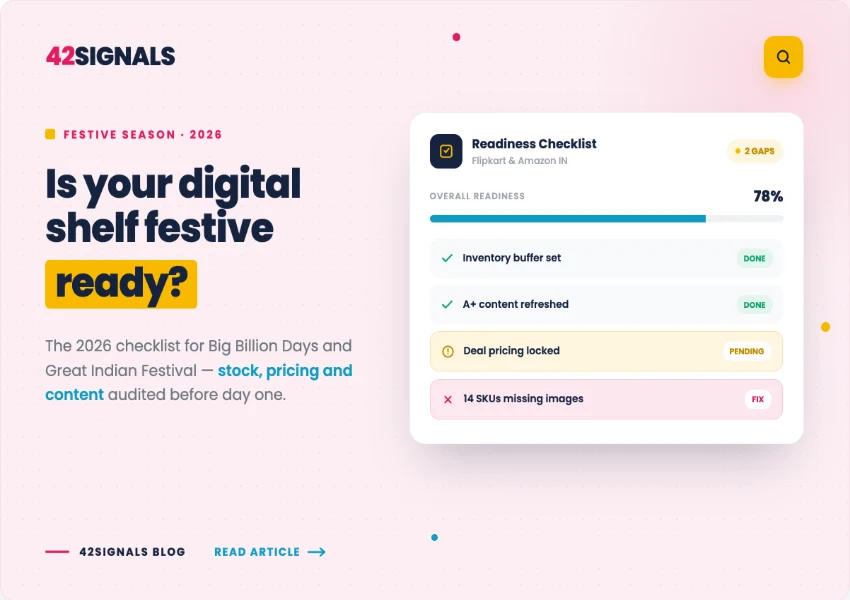
Why Ecommerce Festive Season Outcomes Are Decided Before the Sale Starts
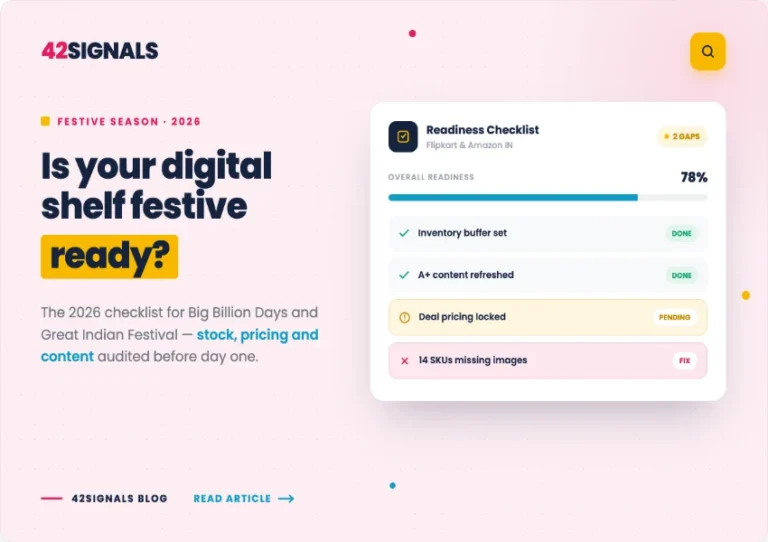
The brands that win Big Billion Days and the Great Indian Festival are not the ones who discount hardest during the sale. They’re the ones whose catalogue, inventory, and shelf position were in order three weeks before it opened. By the time the sale goes live, most of what determines your outcome is locked. Your listings are indexed, or they aren’t. Your stock is positioned, or it isn’t. Your rank on the terms that matter is established or it’s not. What you control during the sale window is narrow bids, promotional timing, and how fast you react to stockouts. This ecommerce festive season checklist is organised by how much time you have left rather than as a single undifferentiated list, because the right action in week six is not the right action in week one. It covers preparation across Amazon, Flipkart, and quick commerce platforms, the daily operating rhythm during the sale, and the post-sale work that most teams skip.
The 2026 Calendar: What’s Confirmed and What Isn’t
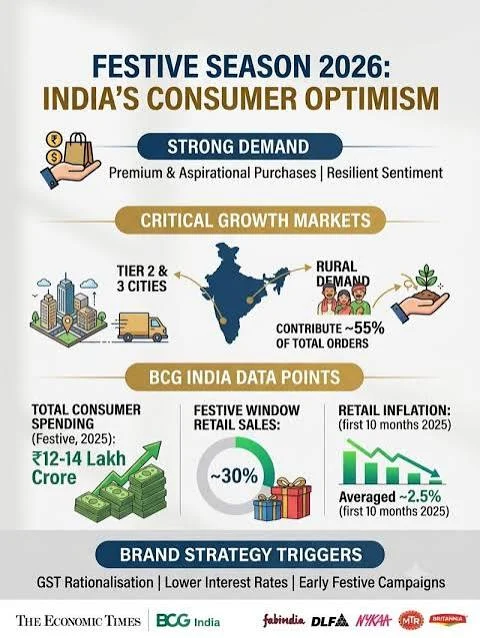
Image Source: LinkedIn
Diwali 2026 falls on 8 November, which anchors the entire festive window.
As of publication, neither Flipkart nor Amazon has officially confirmed 2026 sale dates. Both typically announce one to three weeks ahead. For reference, Flipkart’s Big Billion Days 2025 ran from 23 September to 2 October, with Plus and Black early access from 22 September, and Amazon’s Great Indian Festival opened on 22 September 2025.
Check the official seller portals directly for confirmed dates rather than relying on aggregator projections, which have been contradicting each other.
Two structural points matter more than the exact dates.
The sales overlap. For several consecutive years, both platforms have opened in the same week. Plan for simultaneous demand across both, not sequential.
It isn’t one event. The Great Indian Festival in particular runs as a marathon — deepest deals in the opening window, then refreshed offers in waves through Dussehra and into Diwali. A single-burst plan misreads the shape of the ecommerce festive season entirely.
Phase 1: Four Weeks Out or More
This is where the real work happens. If you have this window, prioritise in this order.
Inventory Positioning and Stockout Prevention
Festive demand surge does not distribute evenly. It concentrates in specific SKUs, specific days, and specific geographies and on quick commerce, in specific dark stores.
Model demand at SKU level, not category level. Last year’s festive uplift by SKU is your best available predictor. Apply it to this year’s assortment and identify the twenty percent of SKUs that will generate most of your festive volume.
Position inventory where it converts. Fulfilment centre placement determines delivery promise, and delivery promise affects both conversion and search ranking. Stock sitting in the wrong region is stock that doesn’t sell during a compressed sale window.
Build a stockout response plan before you need one. A stockout during the ecommerce festive season costs more than the lost sales it costs rank that takes weeks to recover. Decide in advance which SKUs get emergency replenishment priority and who has authority to trigger it at 11pm on day two.
The relationship between stockouts and search visibility is covered in detail in our guide to digital shelf availability, and it’s the single most expensive failure mode in a festive window.
Product Listing Optimization
Listing changes need time to index and stabilise. Making them during the sale is close to useless.
Complete every attribute field. Incomplete listings are invisible to filtered browsing regardless of keyword relevance and festive shoppers filter heavily.
Audit titles and bullets against festive search terms. The terms people use in the ecommerce festive season shift toward gifting, bundles, and value framing. Your evergreen keyword set is a starting point, not the answer.
Refresh images and A+ content. Conversion rate during a high-traffic window compounds a two-point conversion improvement on festive traffic volumes is worth considerably more than the same improvement in February.
Check for suppressed or unbuyable listings. Every catalogue has some. Finding them in week six is routine; finding them on day one of Big Billion Days is a crisis.
Establish Your Share of Search Baseline
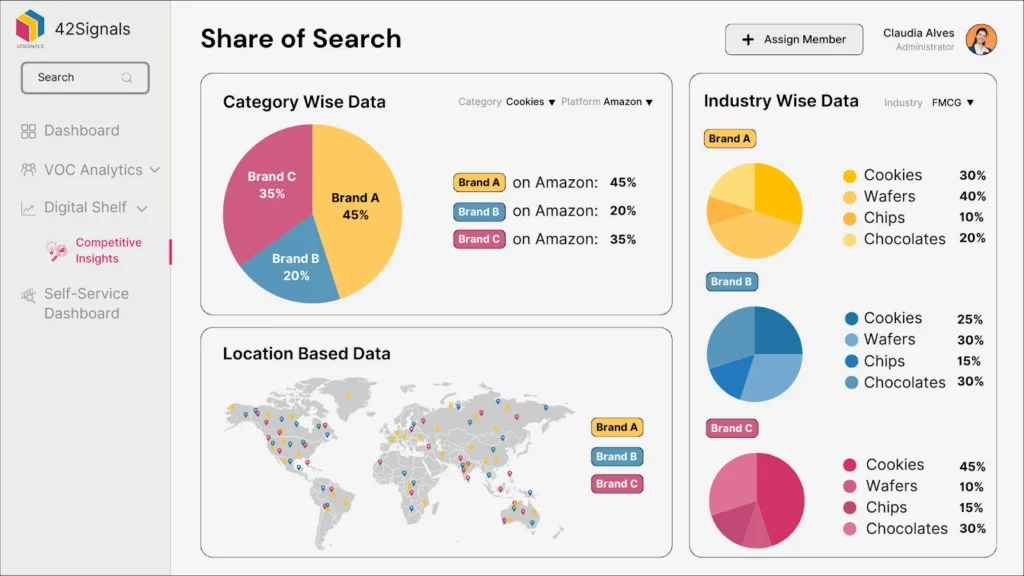
This is the step almost everyone skips, and it’s what makes post-sale analysis possible.
Measure your organic and paid share of search separately on your priority terms for at least three weeks before the sale opens. Without a pre-period, you cannot distinguish festive lift from category lift, and you cannot tell whether your advertising bought incremental volume or defended positions you already held.
Do the same for your competitors. Knowing who occupied the top slots before the sale tells you who moved during it. A structured competitor keyword gap analysis will also surface festive-intent terms your rivals are targeting that you aren’t.
Phase 2: Two Weeks Out
The window for structural changes has closed. This phase is about pricing, protection, and campaign architecture.
Promotional Planning and Price Architecture
Map your discount ladder across the full window. Both platforms run in waves. Decide now which SKUs discount in the opening burst, which hold for the Dussehra refresh, and which you protect entirely through Diwali. Brands that discount everything on day one have nothing left for the wave that converts best.
Model your landed price against competitors, not your list price. Bank offers, exchange bonuses, and platform coupons all move the effective price a shopper pays. A competitor showing a higher list price with a 10% instant bank discount may be cheaper than you at checkout.
Decide your floor before the pressure arrives. Festive price wars start when someone reacts to a competitor without context. Write down the margin floor for each key SKU now, while nobody is panicking.
MAP Enforcement and Unauthorised Sellers
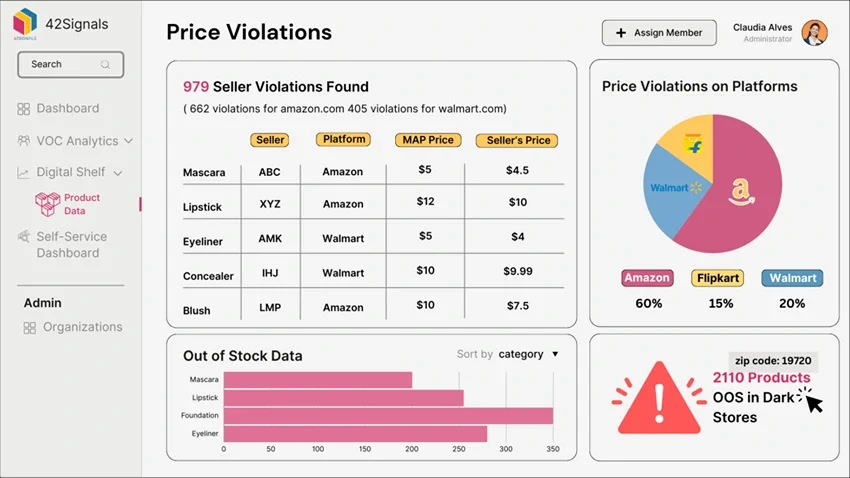
Festive windows are when unauthorised sellers and grey-market inventory surface most aggressively. Deep platform discounting gives cover for listings that undercut your authorised partners.
Two consequences. Your own pricing analysis reads the market as more aggressive than it is, and your authorised retail partners lose sales to sellers who never invested in the relationship. Systematic MAP violation monitoring through the festive window is account management, not compliance paperwork.
Advertising Structure
Separate your festive campaigns from your always-on campaigns. Blending them makes post-sale analysis impossible and risks your evergreen efficiency metrics being distorted by festive CPCs.
Budget for CPC inflation. Competition intensifies across the whole window. Bids calibrated to September economics will underdeliver in the sale.
Bid where your organic visibility is weakest, not strongest. Paying to defend terms you already rank first for is the most common source of wasted festive spend — the same dynamic covered in our guide to Amazon Sponsored Products and pricing ROI.
Phase 3: During the Sale The Daily Operating Rhythm

Image Source: Clever Tap
A compressed sale window rewards fast reaction, which requires knowing what to look at each morning.
Availability first, every day. Check fill rate by SKU and by region — including dark-store level for quick commerce. An out-of-stock SKU with live advertising is spending budget on impressions that cannot convert, and losing rank while it does.
Competitor stockouts second. When a rival goes out of stock in a region where you’re well stocked, demand redistributes to whoever remains visible. This is the highest-value moment in the entire ecommerce festive season to increase bids, and it’s invisible in your own campaign data because it’s a fact about someone else’s shelf.
Price and promotional changes third. Track what competitors actually changed, and specifically whether a drop is a wave-timed promotion or a sustained repositioning. Reacting to a 48-hour flash promotion with a permanent cut is how brands leave margin on the table for the rest of the window.
Share of search fourth. Movement in your organic and paid share tells you whether your position is holding. A slide here predicts a sales decline before the sales data shows it.
Buy Box and listing status fifth. Suppressions, hijacked listings, and unauthorised sellers appear faster during high-traffic windows.
The discipline that matters is a single daily checkpoint with clear owners and pre-agreed thresholds for action — not a WhatsApp group reacting to whatever someone noticed.
Quick Commerce: The Parallel Festive Battle
Blinkit, Zepto, and Instamart run a different festive pattern, and brands that treat them as smaller marketplaces underperform.
The shelf is tiny. Three or four products above the fold means paid placement is often the only route to visibility, not an enhancement to it.
Demand spikes are sharper and more local. Festive quick commerce demand concentrates around specific occasions — Dhanteras, Diwali eve — and specific catchments, often resolving within hours rather than days.
Availability is dark-store level. Your product can be well stocked in one part of a city and unavailable five kilometres away. National fill rate tells you nothing useful here.
The practical requirement is pincode-level monitoring through the festive window. A stockout in a high-demand catchment on Dhanteras is not recoverable once the occasion passes. Our digital shelf analytics guide covers building this monitoring layer across platforms.
Phase 4: Post-Sale — The Part Everyone Skips
The week after Diwali is when the most valuable analysis is possible and least often done.
Compare against your pre-period baseline. Did your organic share of search grow, hold, or fall? A brand whose sales rose while organic share fell bought volume rather than building position.
Separate incremental from attributed. Retail media reporting will show strong attributed ROAS on terms you already owned. Comparing paid against organic share on those terms tells you what you actually gained.
Quantify stockout cost. Identify every SKU that went unavailable, for how long, in which regions, and what the rank recovery looked like afterward. This is the input that justifies next year’s inventory investment.
Check whether category share moved. Festive sales can grow while your share of the category falls, if the category grew faster. That’s a market share tracking question that no platform’s reporting answers.
Document the competitive set. Which brands gained position during the window? New entrants who performed well in festive will be structural competitors next year.
The Complete Festive Readiness Checklist
Four-plus weeks out
- SKU-level demand model built from last year’s festive uplift
- Inventory positioned regionally against expected demand
- Stockout escalation plan with named owners and authority
- Full attribute completion audit across festive SKUs
- Titles and bullets audited against festive search intent
- Images and A+ content refreshed on priority SKUs
- Suppressed and unbuyable listings identified and fixed
- Share of search baseline established, organic and paid separated
- Competitor baseline captured on priority terms
Two weeks out
- Discount ladder mapped across the full multi-wave window
- Landed-price modelling including bank offers and platform coupons
- Margin floor agreed per key SKU, in writing
- MAP monitoring active with enforcement path defined
- Festive campaigns structurally separated from always-on
- Budget adjusted for expected CPC inflation
- Bids weighted toward weak organic visibility, not strong
During the sale, daily
- Fill rate by SKU and region, including dark stores
- Competitor stockouts flagged for bid increases
- Competitor price and promotional changes, with wave context
- Share of search movement on priority terms
- Buy Box status, suppressions, unauthorised sellers
Post-sale
- Organic share compared against pre-period baseline
- Incremental versus attributed performance separated
- Stockout cost quantified by SKU, duration, and region
- Category share movement assessed
- Competitive set updated for next year
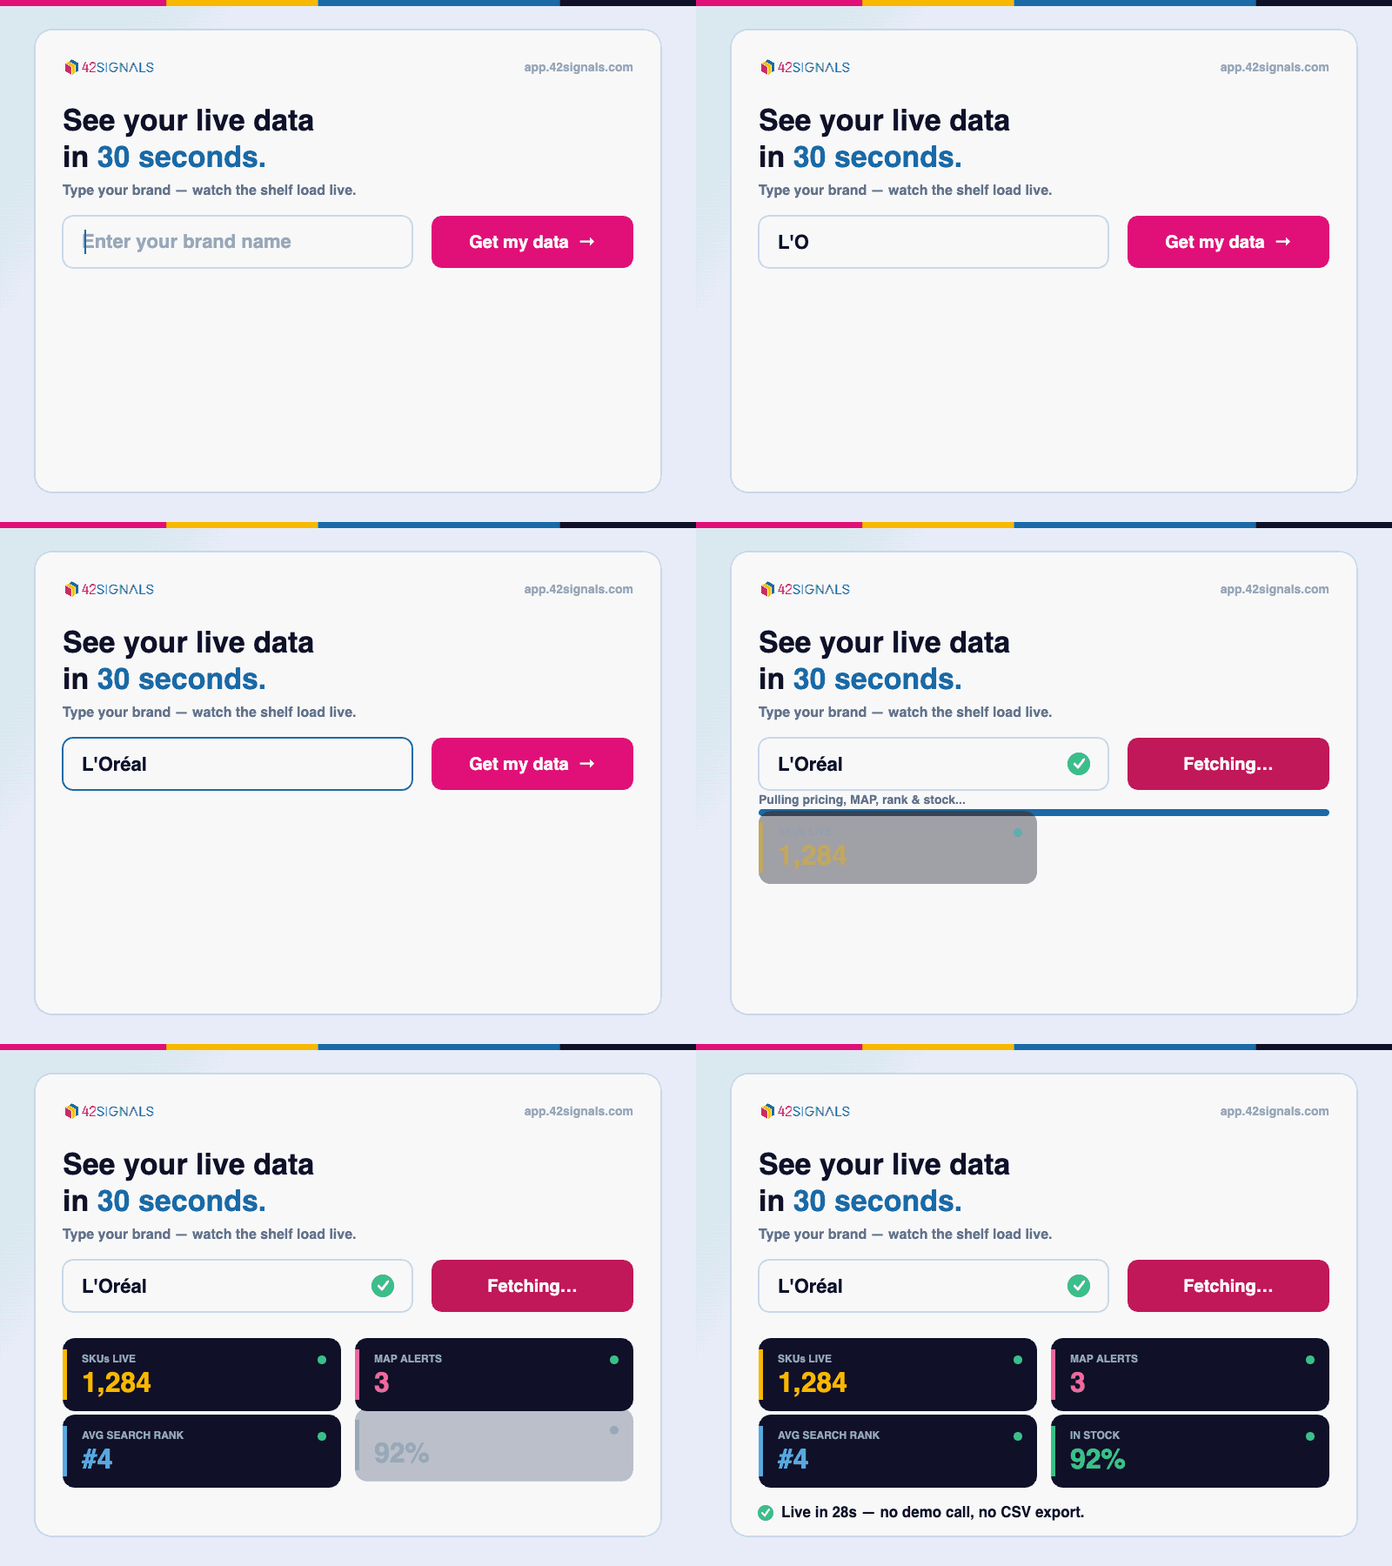
42Signals tracks availability, pricing, share of search, and competitor movement across Amazon, Flipkart, Blinkit, Zepto, and Instamart — at pincode level, through the entire festive window.
Winning the Ecommerce Festive Season Beyond Discounting
The festive window compresses a quarter of demand into a few weeks, which magnifies both preparation and its absence. A stockout that would cost you a day’s sales in June costs you rank, share, and an occasion that doesn’t come back.
What separates the brands that gain share from the ones that simply post big numbers is rarely the depth of discount. It’s whether the catalogue was clean before traffic arrived, whether inventory sat where demand actually was, and whether anyone was watching the shelf closely enough to notice a competitor’s stockout while the window was still open.
Most of that is decided in the weeks before the sale. The rest is decided by how quickly you can see what’s happening while it happens — which, on a shelf that varies by platform, by region, and by dark store, is a measurement problem before it’s a merchandising one.
Both platforms will confirm their 2026 dates shortly. Whether that announcement is a starting gun or a deadline depends entirely on what you’ve already done.
42Signals gives brand and category teams real-time visibility across every Indian marketplace and quick commerce platform — so festive decisions are made on current data rather than yesterday’s report.
Frequently Asked Questions About Ecommerce Festive Season Preparation
When do Big Billion Days and the Great Indian Festival start in 2026?
Neither Flipkart nor Amazon had officially confirmed 2026 dates at the time of writing, and aggregator projections have been contradicting each other. Both platforms typically announce one to three weeks ahead. For reference, Big Billion Days 2025 ran from 23 September to 2 October, with early access for Plus and Black members from 22 September, and the Great Indian Festival opened on 22 September 2025. With Diwali 2026 on 8 November, expect the overall festive window to run from late September through early November. Check the official seller portals for confirmed dates.
How far in advance should brands prepare for the festive sale?
Structural work needs four to eight weeks inventory positioning, listing content, attribute completion, and catalogue fixes all require lead time to take effect and be indexed. The final two weeks are for pricing architecture, promotional planning, MAP monitoring, and campaign structure. If you have less than two weeks, focus on availability, price parity, and having a daily monitoring rhythm in place rather than attempting catalogue changes that won’t index in time.
What is the biggest mistake brands make during festive sales?
Treating the window as a single burst rather than a series of waves. Both platforms refresh offers across the period, and brands that discount everything in the opening days have no lever left for the later waves — which often convert better. The second most costly mistake is running advertising against SKUs that have gone out of stock, which spends budget on impressions that cannot convert while losing search rank at the same time.
How do stockouts affect festive season performance?
More severely than at any other time of year. Beyond the immediate lost sales, marketplace algorithms deprioritise unavailable products, so rank falls and takes weeks to recover often well past the festive window entirely. During a compressed sale period with elevated traffic, a stockout in a high-demand region can cost an entire occasion. Daily fill-rate monitoring by region, and dark-store level for quick commerce, is the only reliable defence.
Should brands advertise on quick commerce during the festive season?
Usually yes, because the visible shelf is small enough that paid placement is often the only route to visibility. The prerequisite is confirmed availability at dark-store level. Quick commerce festive demand spikes sharply around specific occasions like Dhanteras and Diwali eve, and it concentrates by catchment, so advertising into a pincode where you’re out of stock is spend that cannot convert, and the occasion won’t repeat.
How do I measure whether my festive campaigns actually worked?
Establish a baseline before the sale covering organic share of search, category rank, and availability, measured for at least three weeks. Then compare reported performance against movement in those independent metrics. If a platform reports strong ROAS while your organic share was flat or declining, much of that attributed revenue was demand you already owned. Without a pre-period, reported lift has nothing meaningful to be measured against.
What should brands track during the sale itself?
Five things daily, in order: fill rate by SKU and region; competitor stockouts, which signal the best moments to raise bids; competitor price and promotional changes with enough context to tell a flash promotion from a repositioning; share of search movement on priority terms; and Buy Box status including suppressions and unauthorised sellers. A single daily checkpoint with named owners and pre-agreed action thresholds beats reactive monitoring.