
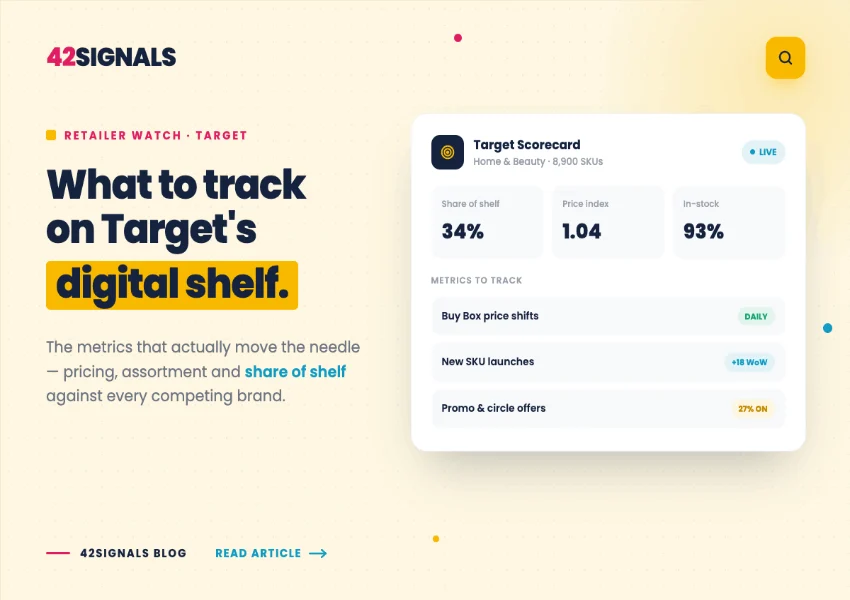
Why Target Competitor Analysis Looks Different Now
For most of the past three years, the competitive question about Target was whether it could stop losing ground. That question has been answered, and it changes what brands selling into Target need to watch.
Target returned to positive comparable sales in Q1 FY2026 after five consecutive negative quarters, then followed with Q2 net sales up 5.3% and comparable sales up 3.8% on a 3.6% traffic increase (source: Target Q2 FY2026 earnings release). Management raised full-year net sales guidance to around 5% growth.
More consequentially for brands: the fastest-growing parts of Target’s business are no longer merchandise at all. Non-merchandise revenue Roundel advertising, Target Circle 360 memberships, and the Target+ marketplace grew over 20% in Q2, with Target+ GMV up more than 40% (Target Q2 FY2026).
That shift is the substance of any current target competitor analysis. The shelf you’re competing on now includes third-party marketplace sellers, paid placements sold by the retailer itself, and a same-day delivery layer that varies by store. This article covers where Target sits against its rivals, and then what brands should actually be tracking.
Where Target Sits Competitively
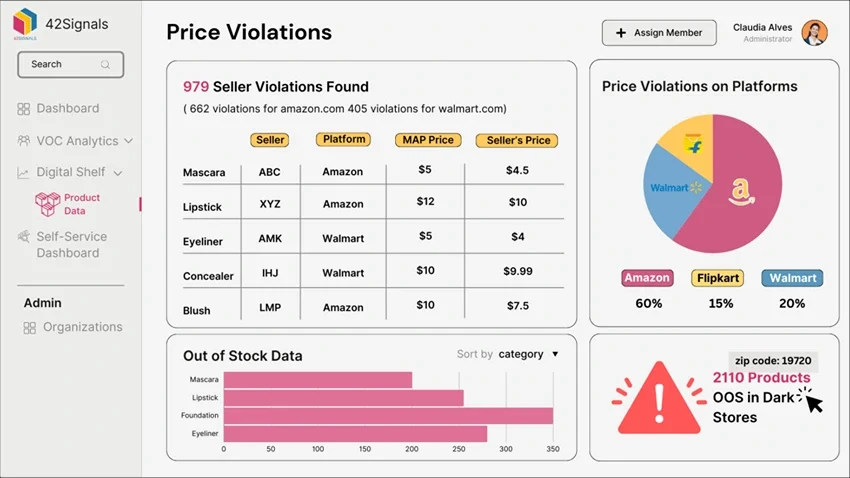
Any honest target competitor analysis starts with the same three names, and the “squeezed in the middle” framing that has followed Target for years.
The Walmart Comparison
Walmart is the direct format rival, and on digital metrics it is growing considerably faster. In the comparable quarter Walmart reported 26% global ecommerce growth, US advertising up 36%, and marketplace sales up nearly 50% (source: company reporting via Yahoo Finance; verify against Walmart’s own release before publishing).
Set against Target’s digital comparable sales growth of 8.7% and Roundel gross billings growth of about 20%, the gap is real. Walmart is scaling its marketplace and retail media faster from a larger base.
Where Target holds ground is traffic quality and category mix. Q2 comparable traffic rose 3.6%, and all six core merchandise categories grew, with double-digit growth in hardlines and high single-digit growth in food and beverage and in beauty (Target Q2 FY2026). Target is not winning on scale; it’s winning on the discretionary and style-led categories Walmart converts less well.
The Amazon Comparison
Amazon owns replenishment — the repeat, low-consideration reordering that generates enormous volume with no discovery cost. Target has not challenged this and probably won’t.
What Target has built instead is a same-day delivery proposition tied to physical stores, growing more than 25% in Q2 and anchored by Circle 360 membership, whose revenue rose over 40% (Target Q2 FY2026). That’s a structurally different offer from marketplace logistics: fulfillment from a store two miles away rather than a fulfilment centre two states away.
What This Means for Your Analysis
The competitive set depends on what you sell. In food and consumables, Target competes with Walmart and Kroger on price and availability. In beauty, style, and home, it competes on assortment and exclusives, where its position is stronger. In replenishment categories, the real competitor for your volume is Amazon, and your Target performance is a smaller part of the picture than it appears.
Brands running one undifferentiated target competitor analysis across a mixed portfolio get an average that describes none of their categories accurately.
Target’s Digital Flywheel Changes the Shelf
Roundel
Roundel is Target’s retail media network. Advertising revenues reached $246 million in Q1 FY2026, up from $163 million a year earlier (source: Target Q1 FY2026 earnings release and company commentary), with gross billings growing near 20% in Q2.
The practical consequence: a growing share of visible placement on Target.com is bought rather than earned. Your organic ranking matters less if competitors are buying the positions above you — and Roundel reports your own performance using its own attribution, which is the standard structural conflict across every retail media network.
Target Plus
Target+ is an invite-only third-party marketplace, and its GMV grew more than 40% in Q2 after growing nearly 60% in Q1 (Target Q1 and Q2 FY2026).
This is the development of most brands underweight in their target competitor analysis. Third-party sellers now appear alongside first-party assortment, which means your competitive set on a given search term may include sellers who never went through a Target buyer. It also means unauthorised sellers can surface next to your listing — a pricing and brand control problem as much as a competitive one.
Circle 360 and Same-Day
Circle 360 revenue grew over 40%, and same-day delivery grew more than 25% (Target Q2 FY2026). Same-day fulfillment is store-based, so a shopper’s experience of your availability depends on the specific store serving their address not on Target’s national inventory position.
What Target Competitor Analysis Should Actually Track
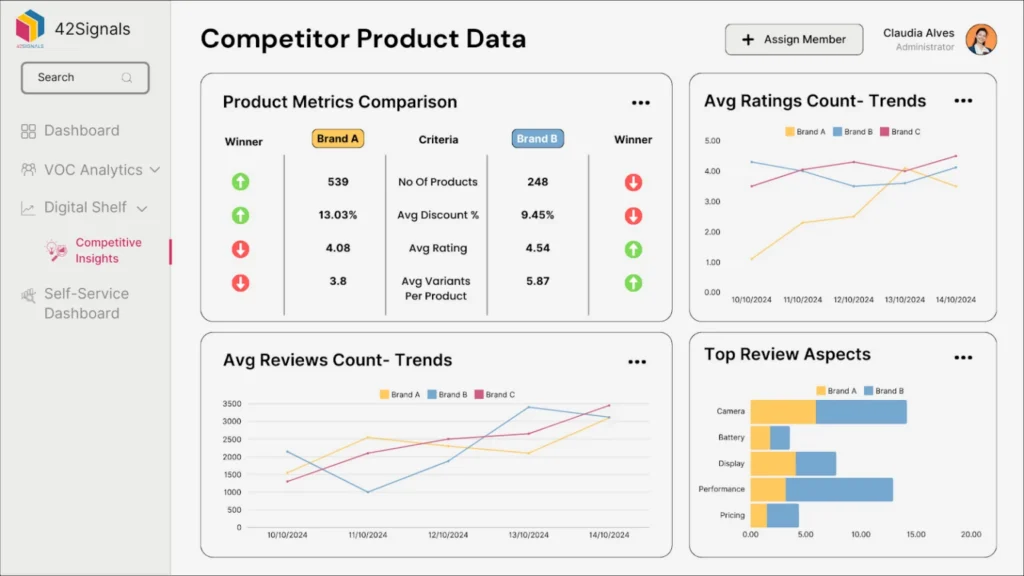
Five things, in rough order of how often they get missed.
Share of Search, Organic and Paid Separately
The proportion of visible results you own on your priority terms, split between what you earned and what you bought. This is the closest available proxy for shelf presence.
Track the ratio over time. If your paid share climbs while organic share falls, Roundel spend is masking a listing or assortment problem rather than solving it. The mechanics are the same ones covered in our competitor keyword gap analysis guide including the terms rivals win that you aren’t bidding on at all, which by definition never appear in your own reporting.
Assortment and Category Coverage
Which competitor SKUs Target carries that yours doesn’t, where competitors have secured more facings or more variants, and which Target+ third-party sellers have entered your category.
Assortment changes are leading indicators. A competitor expanding from three SKUs to eight in your subcategory is a shelf-share move that shows up in your sales data months later.
Price and Promotional Position
Target lowered prices on more than 10,000 items over the past year (Target Q2 FY2026), which tells you value perception is an active battleground. Your analysis needs competitor pricing, promotional mechanics — a coupon, a Circle offer, and a straight discount demand different responses — and your own price parity across channels.
With Target+ carrying third-party sellers, MAP violation monitoring becomes part of competitor tracking rather than a separate compliance function. An unauthorised seller undercutting you on Target+ distorts every pricing decision downstream.
Availability at Store Level
Because same-day fulfils from stores, national in-stock rates conceal the variation that matters. A SKU can read as available nationally and be unavailable in the metros generating most of your demand.
Availability is also a competitive opportunity: when a rival goes out of stock in a region where you’re well stocked, demand redistributes to whoever remains visible. That’s the highest-value moment to raise Roundel bids, and it’s invisible in your own campaign data. Our guide to digital shelf availability covers the tracking approach.
Content and Review Position
Ratings, review velocity, and content completeness on competitor listings. Conversion is a function of price and trust, so a competitor priced below you with deteriorating recent reviews is a smaller threat than their price suggests. Tracking review sentiment alongside pricing tells you whether a price gap will actually cost you the sale.
The Measurement Gap in Roundel Reporting
Roundel reports your campaign performance. Like every retailer-owned media platform, it is simultaneously the seller of the media and the auditor of the result.
Two specific gaps matter.
Attributes are not incremental. If you already hold strong organic placement on a term, attributed ROAS on that keyword will look excellent — because those shoppers were converting before you paid. Comparing paid share of voice against organic share of voice on the same terms is the only way to see how much you’re paying to defend ground you already held.
Campaign metrics aren’t category metrics. Your Target sales can grow while your category share falls, if the category grew faster. Target’s own reporting won’t surface that; it’s a market share tracking question measured against the whole category rather than your account.
The fix is a baseline established before campaigns launch — organic share, category rank, store-level availability — measured for several weeks pre-flight. Without a pre-period, reported lift has nothing to be measured against.
Building a Target Competitor Analysis Workflow
A workable cadence rather than a quarterly deck nobody reads.
Weekly: price and promotional changes on your tracked competitor set, availability by region on your top SKUs, and share of search movement on your priority terms. These change fast enough that monthly review means finding out after it cost you.
Monthly: assortment changes, new Target+ sellers in your categories, review velocity and sentiment shifts, and Roundel performance compared against your independent share-of-voice data rather than against itself.
Quarterly: category share against the whole category, competitive set review — the brands winning your terms may not be the ones you started tracking — and reallocation of media spend toward terms where organic visibility is weakest rather than strongest.
The competitive set question deserves emphasis. Most brands define competitors from category management history and then never revisit it. On a marketplace where third-party GMV grew over 40% in a quarter, your actual competition for a search term changes faster than your tracked list does. Our comparison of competitor analysis tools covers the platforms that automate this, and the broader framework sits in our digital shelf analytics guide.
42Signals tracks share of voice, pricing compliance, competitor assortment, and store-level availability across Target and every other retailer you sell through the independent baseline retailer reporting doesn’t provide.
Common Mistakes in Target Competitor Analysis
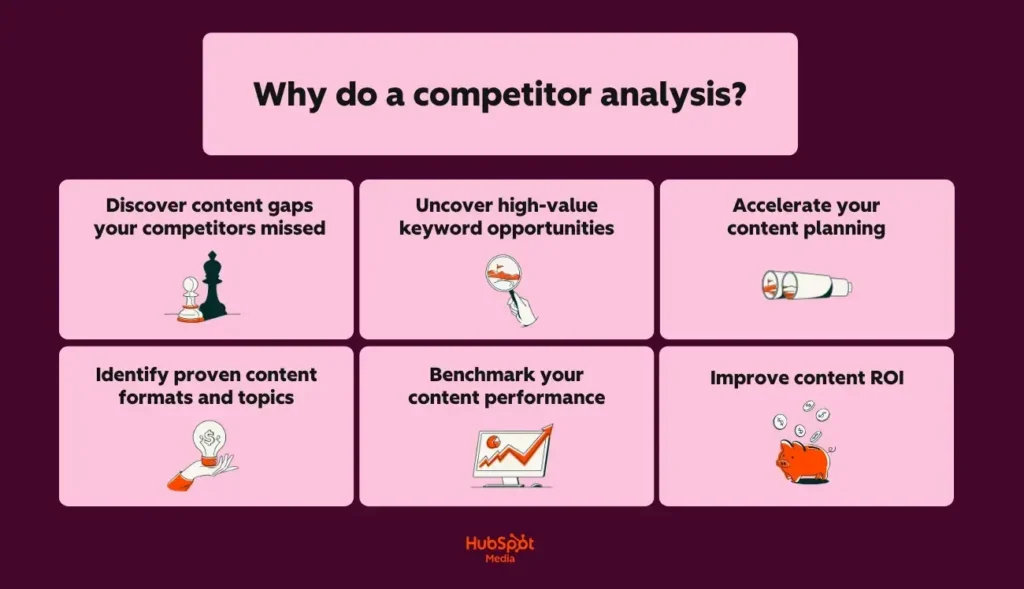
Image Source: Hubspot
Treating Target like Amazon. Different search behaviour, different assortment logic, different fulfilment model. Analysis frameworks port over; conclusions don’t.
Ignoring Target+ sellers. Third-party GMV growing above 40% means your competitive set includes sellers who bypassed the buyer relationship entirely.
Using national availability data. Same-day fulfillment from stores. National in-stock rates hide the regional gaps that cost you sales and waste your media spend.
Accepting Roundel’s ROAS as the whole answer. Strong attributed performance on terms you already own organically is not incremental revenue.
Running one analysis across a mixed portfolio. Target’s competitive position differs sharply by category — stronger in beauty, style, and home; more exposed in consumables. An averaged view describes nothing accurately.
Reviewing the competitive set annually. It changes quarterly now.
Turning Target Competitor Analysis Into Category Share
Target has stabilised. Two consecutive quarters of comparable sales growth, traffic up, guidance raised, and — as its CEO put it — a stated intent to make that durable rather than declare victory in two quarters.
For brands, the more useful reading is that the composition of Target’s growth has shifted toward businesses that change how you compete. Roundel means more of the shelf is bought. Target+ means more of your competition arrived without a buyer meeting. Same-day means your availability is a store-level question rather than a national one.
None of those shifts are visible in the reporting Target gives you. Roundel will tell you how your campaigns performed. Category reviews will tell you how your account performed. Neither tells you your share of the shelf, whether your availability held where demand concentrated, or whether a third-party seller has quietly taken the placement you were counting on.
A target competitor analysis worth running answers three questions the retailer’s data can’t: what proportion of visible placement do you own and how much of it did you buy, did your availability hold in the regions that matter, and did your category share move. Everything else is reporting rather than analysis.
The brands gaining share at Target are the ones measuring their own position accurately enough to know where they’re actually winning — and honest enough to notice when strong reported performance is defending ground they already had.
Alt text: see your brand’s shelf on online marketplaces like Amazon, Walmart, Target, Flipkart, Swiggy Instamart, Blinkit, Zepto with 42Signals data
42Signals gives category teams an independent view of the shelf across Target, Walmart, Amazon, and quick commerce share of voice, competitor assortment, pricing, and availability in one place.
Frequently Asked Questions About Target Competitor Analysis
Who are Target’s main competitors?
Walmart and Amazon are the primary rivals, with Costco, Kroger, and club and dollar formats competing in specific categories. Walmart is the direct format competitor and is currently scaling ecommerce, marketplace, and retail media faster. Amazon dominates replenishment purchasing. Target’s stronger relative position is in discretionary and style-led categories — beauty, home, and apparel — where it competes on assortment and exclusives rather than price.
What should a brand track in a Target competitor analysis?
Five things: share of search with organic and paid separated, competitor assortment and SKU coverage changes, price and promotional position including Target+ third-party sellers, availability measured at store level rather than nationally, and competitor review velocity and content quality. Retailer-supplied reporting covers your own performance but not your position relative to the shelf.
How does Target Plus affect competitor tracking?
Target+ is an invite-only third-party marketplace whose GMV has been growing above 40% year over year. Third-party sellers appear alongside first-party assortment, which means your competitive set on a search term can include sellers who never went through a Target buyer — and can include unauthorised sellers of your own products. Any competitive tracking that only covers first-party assortment now has a growing blind spot.
Is Roundel advertising worth it for brands?
On-site placements at the point of purchase are among the more efficient formats available, and Roundel’s growth reflects real advertiser demand. The caution is measurement: Roundel reports performance using its own attribution, and attributed sales are not incremental sales. A brand already ranking well organically on a term will see strong reported ROAS while gaining little genuine lift. Compare paid against organic share of voice before scaling spend.
How often should I run a Target competitor analysis?
Price, availability, and share of search need weekly review because they move fast enough that monthly checks find problems after they’ve cost you. Assortment changes, new Target+ sellers, and review sentiment suit a monthly cadence. Category share and a review of who your competitors actually belong in a quarterly cycle — the competitive set changes faster than most brands update it.
Why does store-level availability matter for Target?
Target’s same-day delivery fulfils from physical stores rather than central fulfilment centres, and it grew more than 25% year over year. That makes a shopper’s experience of your availability dependent on the specific store serving their address. A SKU showing healthy national inventory can be unavailable in the metros generating most of your demand, and any advertising running against those locations is spend that cannot convert.
How is Target performing against Walmart right now?
Target has returned to growth — Q2 FY2026 net sales rose 5.3% with comparable sales up 3.8% and traffic up 3.6%, and full-year guidance was raised to around 5%. On digital and retail media specifically, Walmart is growing considerably faster from a larger base. The reasonable summary is that Target has stabilised and is competing effectively in discretionary categories, while Walmart continues to lead on marketplace and advertising scale.