Price Elasticity in E-Commerce for Online Brands
Price elasticity in e-commerce quantifies how sensitive your e-commerce sales volume is to price changes, providing a framework to move beyond cost-plus pricing to revenue-maximizing strategies. By calculating the Price Elasticity of Demand (PED) — the percentage change in quantity demanded divided by the percentage change in price — you can determine if your product is elastic (sensitive, PED > 1) or inelastic (insensitive, PED < 1). This elasticity number, combined with your marginal cost, is used in the Optimal Price Formula to find the price point that maximizes contribution margin. To implement this effectively, brands must conduct continuous A/B price testing, monitor competitor pricing in real time, and integrate these insights into a dynamic pricing strategy to ensure prices adapt to changing market conditions and maximize profitability.
Pricing is the primary purchase criterion for 60% of consumers, according to research by Prisync — yet most e-commerce brands set prices based on cost-plus logic rather than demand signals. The result is money left on the table at every price point.
Price elasticity of demand gives you the framework to stop guessing. It quantifies exactly how much your sales volume will shift when your price moves — and from that, you can calculate the price point that maximizes revenue rather than just protecting margin.
This guide covers what price elasticity is, how to calculate it, how to find your optimal price, and how to build a testing and dynamic pricing system that keeps you calibrated as markets change.
What Is Price Elasticity of Demand?
Price elasticity of demand measures the percentage change in quantity demanded relative to a percentage change in price. In plain terms: if you raise your price by 10%, how much does your sales volume drop?
The formula:
Price Elasticity of Demand (PED) = % Change in Quantity Demanded ÷ % Change in Price
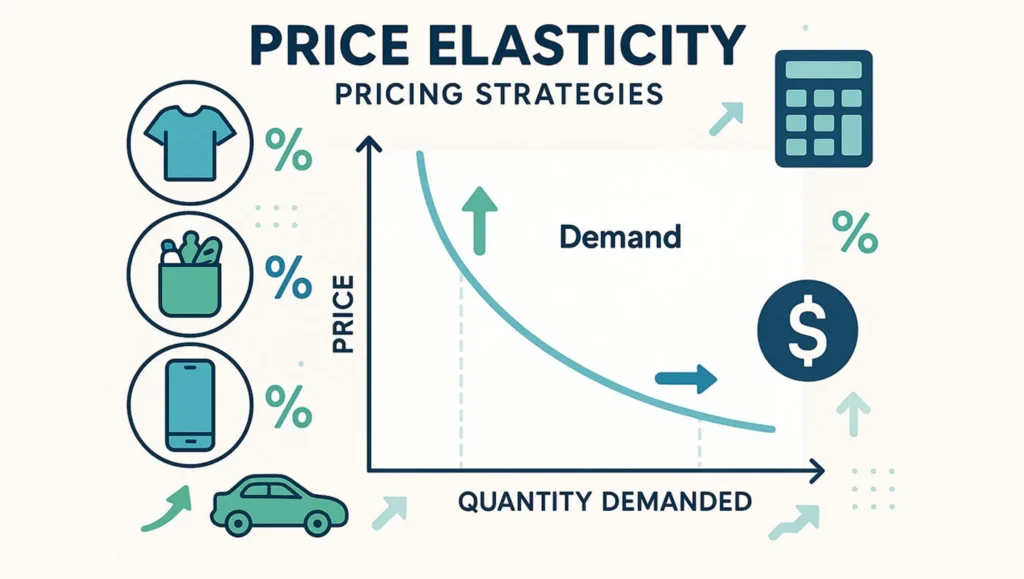
Image Source: The Genie Lab
If you raise a product’s price from $50 to $55 (a 10% increase) and sales drop from 200 units to 160 units (a 20% decrease), the PED is:
−20% ÷ 10% = −2.0
The result is typically negative (higher price = lower demand), so most calculations use the absolute value. A PED of 2.0 means a 1% price change produces a 2% change in quantity demanded.
What Your Elasticity Number Means
| PED Value | Classification | What It Means |
| Greater than 1 | Elastic demand | Consumers are sensitive to price; a small price increase causes a large demand drop |
| Less than 1 | Inelastic demand | Consumers are price-insensitive; demand holds even as price rises |
| Equal to 1 | Unit elastic | Price change and demand change are proportionate |
| Equal to 0 | Perfectly inelastic | Demand doesn’t change regardless of price (rare in practice) |
The practical rule: if your PED is greater than 1, lowering price can increase total revenue. If it’s less than 1, raising price can increase total revenue — because fewer units are lost than the margin gained.
Elastic vs Inelastic Demand: What’s the Difference?
Understanding where your products fall on the elasticity scale is the foundation of any e-commerce pricing strategy.

Image Source: Ecommerce Fastlane
Elastic Demand
Elastic demand is characterized by a significant change in quantity purchased in response to price fluctuations. When price goes up, many customers leave; when price goes down, volume surges. Elastic demand products typically have:
- Available substitutes (a competitor sells something nearly identical)
- No strong brand loyalty
- Non-essential, discretionary use cases
- High price relative to income
Examples of elastic demand products in e-commerce: fashion and clothing, consumer electronics, furniture, luxury goods, accessories, and most commodity categories where comparison shopping is easy.
A clothing store selling last-season jeans is a classic example: the store owner would most likely lower the price to encourage consumers to buy remaining inventory before the next season’s stock arrives. The demand is elastic — consumers have no urgency or loyalty to spring jeans, so price is the primary lever.
Inelastic Demand
Inelastic demand means consumers continue purchasing even when prices fluctuate, because the product is a necessity, has no real substitute, or represents a small portion of income.
Examples of inelastic demand: prescription medications, electricity, gasoline, and staple food items. In e-commerce contexts, proprietary consumables (ink cartridges, specific software subscriptions, brand-loyal supplement repeat purchases) often behave as relatively inelastic demand.
The Elastic vs Inelastic Demand Spectrum
Few products are perfectly elastic or perfectly inelastic — most fall somewhere on a spectrum. Price elasticity of demand also varies by:
- Price range: The same product can be inelastic at a low price and elastic at a higher price
- Time horizon: Demand is often more elastic in the long run as consumers find alternatives
- Customer segment: Budget shoppers are elastic; loyal or high-income customers are less so
- Context: A coffee at an airport is more inelastic than the same coffee at a high-street café
What Determines Price Elasticity? The Key Factors
Several factors influence whether a product will have elastic or inelastic demand:
1. Availability of substitutes. The more alternatives available, the more elastic the demand. If a customer can easily find a similar product at a lower price, elasticity is high. This is why clothing and consumer electronics have high elasticity — every category has dozens of competing brands.
2. Degree of necessity. Essential goods (medications, staples) are inelastic. Discretionary goods (entertainment, fashion, luxury items) are elastic. The more “nice to have” your product, the more sensitive demand is to price.
3. Brand strength. Strong brand loyalty reduces elasticity. Apple products, for instance, are more inelastic than generic alternatives because the brand itself creates switching costs. In e-commerce, differentiated brand positioning is one of the few levers sellers can use to reduce their price sensitivity.
4. Proportion of income. Expensive items represent a larger share of income, so consumers research more before buying — making demand more elastic. Low-cost consumables are purchased without much deliberation, making them relatively inelastic.
5. Time period. Demand is typically more inelastic in the short run. If petrol prices spike, you still fill up your tank tomorrow — but over 12 months, you might buy a more fuel-efficient car. In e-commerce, short-term inelasticity can mask long-term churn risk.
The Optimal Price Formula: How to Calculate Your Best Price Point
Once you know your price elasticity, you can calculate the revenue-maximizing price point. The optimal pricing formula derived from elasticity is:
Optimal Price = (Elasticity ÷ (Elasticity + 1)) × Marginal Cost
For example: if your PED is −2.0 and your marginal cost (cost to produce and fulfill one additional unit) is $25:
Optimal Price = (−2 ÷ (−2 + 1)) × $25 = (−2 ÷ −1) × $25 = $50
This is the Lerner pricing rule and represents the price at which you maximize contribution margin given the elasticity of your market. It’s a starting point — your actual optimal price will need to account for competitive positioning, minimum margin requirements, and perceived value.
Note: This calculation requires an estimated PED value. The most reliable way to get that number is through A/B price testing or regression analysis on historical sales data, both covered below.
How to Determine Optimal Pricing for Your E-Commerce Products
Step 1: Conduct Market Research
Before you can set an optimal price, you need to know the range your market will accept. Market research for pricing involves:
- Competitive price benchmarking: What are comparable products selling for, across which channels, and at what promotional cadence?
- Customer surveys: Willingness-to-pay surveys (Van Westendorp price sensitivity meter or Gabor-Granger method) give direct data on acceptable price ranges
- Review analysis: Customer reviews on your products and competitors’ products often reveal whether buyers feel they got value or feel overcharged — a proxy for price perception
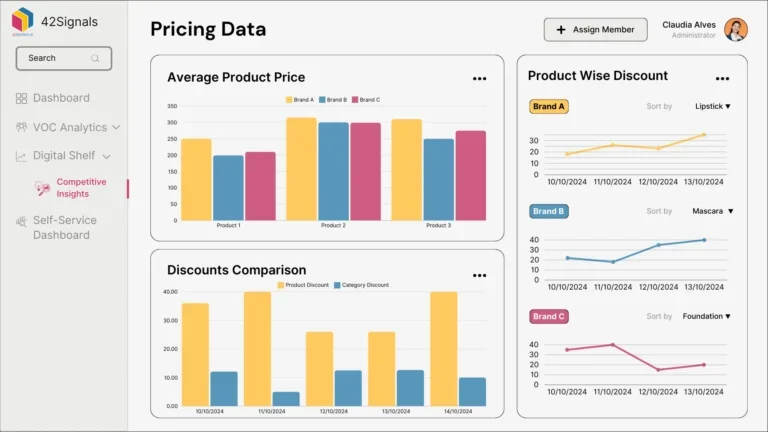
E-commerce analytics platforms like 42Signals can automate competitive price monitoring, flagging competitor price changes, promotions, and out-of-stock events that affect your relative positioning.
Step 2: Analyze Your Full Cost Structure
Optimal pricing starts with knowing your floor — the minimum price at which you’re profitable. This isn’t just COGS. Your true cost floor for an e-commerce product includes:
- Cost of goods / raw materials
- Inbound freight and import duties
- Warehouse storage (per unit per month)
- Outbound shipping and fulfillment fees
- Packaging
- Returns rate × return processing cost
- Platform fees (Amazon seller fees, Shopify transaction fees, etc.)
- Allocated marketing spend per unit
Once you have a fully-loaded unit cost, you can work upward from the profitability floor rather than downward from a market price that looks good but destroys margin.
Step 3: Monitor Competitor Pricing Continuously
Competitor price monitoring is not a one-time research event — it’s a continuous input. Price elasticity testing on platforms like Shopify or Amazon marketplaces means your relative price matters as much as your absolute price. If you hold price but a competitor drops theirs, your effective elasticity changes.
Use price monitoring tools to track:
- Competitor base price changes
- Promotional events (sale events, bundle pricing, coupon codes)
- Availability signals (out-of-stock = pricing opportunity; new entrant = potential price pressure)
- Price elasticity analytics across your category
Platforms like 42Signals provide real-time competitor pricing data and price elasticity analytics dashboards, particularly useful for brands selling in multi-seller environments where the price landscape shifts daily.
Step 4: Run A/B Price Testing
A/B testing is the most reliable method for e-commerce price elasticity testing because it uses your actual customer base under real purchase conditions — not survey responses.
How to set up a price elasticity test:
- Select a single product or SKU with sufficient monthly volume (minimum 200+ conversions per variant recommended for statistical significance)
- Split your traffic into two cohorts — serve each cohort a different price point
- Run the test for at least 2-4 weeks to account for day-of-week variation
- Measure: conversion rate, revenue per visitor, and total revenue — not just units sold
- Calculate the implied PED from the results and feed it into the optimal price formula
For Shopify merchants, third-party A/B testing apps enable split URL testing for pricing. For larger operations, server-side experiments with proper randomization at the user level produce cleaner data.
What to avoid: Avoid sequential testing (running price A for two weeks, then price B). Seasonality and external events will contaminate the results. True concurrent A/B testing is the only clean method.
Step 5: Implement Dynamic Pricing
Dynamic pricing adjusts your prices in real time based on demand signals, inventory levels, competitor pricing, and market conditions. This is the strategy used by Amazon (which reprices products millions of times per day) and has become increasingly accessible for smaller brands.
Signals that should trigger price adjustments:
- High demand / low inventory: Price up to protect margin and manage sell-through rate
- Low demand / high inventory: Price down to stimulate volume and clear stock before reorder
- Competitor out of stock: Price can hold or increase while they’re unavailable
- Competitor price drop: Evaluate whether to match, compete on value, or accept share loss
- Seasonal demand peaks: Pre-load price increases during predictable high-demand windows
Dynamic pricing works best when your pricing elasticity model is calibrated — meaning you know approximately what demand response to expect from each price move. Without that calibration, dynamic pricing can erode trust (customers who see prices fluctuate widely often feel manipulated) or leave money on the table through unnecessary discounting.
Price Elasticity by Product Category: What to Expect
Price elasticity varies significantly by category, and understanding category-level benchmarks helps calibrate expectations before you have your own data.
High elasticity categories (typically PED > 1.5):
- Fashion and clothing (price elasticity of demand for clothing is well-documented as high — substitutes are abundant, and brand loyalty is fragile)
- Consumer electronics (non-flagship; commodity tech accessories)
- Home décor and non-essential furniture
- Impulse purchase categories
Moderate elasticity categories (PED 0.5–1.5):
- Branded packaged goods
- Subscriptions with moderate switching costs
- Personal care products with moderate brand loyalty
Lower elasticity categories (PED < 0.5):
- Proprietary consumables (ink, filters, accessories that only fit specific devices)
- Prescription and OTC medications sold online
- Essential food and household staples
- Digital products with no close substitute
One emerging area worth noting: price elasticity of demand for digital games and software shows highly elastic behavior at launch (where alternatives are few) but inelastic behavior in the long tail — players who have invested time in a game are unlikely to churn over a modest price increase. This has implications for subscription pricing in SaaS and gaming alike.
Similarly, price elasticity for online food delivery tends to be moderate at low to mid price points but becomes highly elastic once delivery fees cross psychological thresholds — explaining why platforms like Instacart and DoorDash are so aggressive with subscription models that flatten the per-order cost.
Building a Price Elasticity Analytics Dashboard
A price elasticity analytics dashboard should give you ongoing visibility into how your pricing decisions are performing relative to demand. Core metrics to track:
| Metric | What It Tells You |
| Revenue per visitor | Captures both price and conversion rate in one metric |
| Conversion rate by price point | Direct demand signal |
| Units sold vs. revenue (tracked separately) | Catches cases where volume rises but revenue falls |
| Margin per unit over time | Flags when discounting erodes profitability |
| Competitor price index (your price ÷ average competitor price) | Tracks your relative position |
| Price change event log | Lets you correlate price moves to demand outcomes |
Platforms like 42Signals provide these analytics views alongside competitor pricing data, enabling brands to build pricing elasticity models from live market data rather than historical internal data alone.
Pricing Elasticity Machine Learning: The Next Level
For brands with sufficient transaction volume (typically 10,000+ orders per month), machine learning can significantly improve pricing accuracy beyond manual A/B testing.
ML-based price elasticity models:
- Estimate PED at the SKU level, by customer segment, and by channel simultaneously
- Account for cross-price elasticity (how a price change on product A affects sales of product B — important for catalog sellers)
- Incorporate external signals (seasonality, competitor events, macroeconomic indicators) that manual models miss
- Update continuously as new transaction data comes in
Several retail pricing optimization platforms (Revionics, Competera, and the pricing module in tools like Prisync) offer ML-based pricing elasticity optimization. The key question before investing in these tools is whether your data volume and product complexity justifies the cost — for most SME e-commerce operations, well-designed A/B testing combined with automated competitor monitoring will capture 80% of the value.
Common Mistakes in E-Commerce Price Elasticity Testing
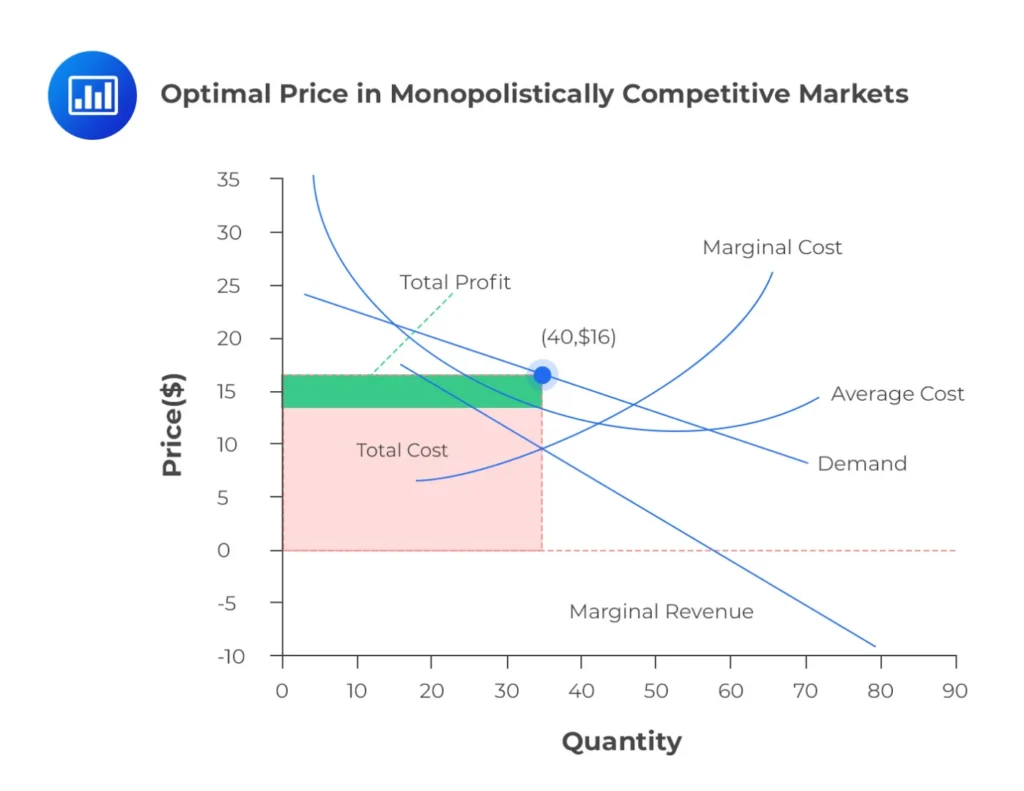
Image Source: Analyst Prep
The common mistakes most brands make when testing e-commerce price elasticity are –
Testing too short. A one-week price test is almost never statistically significant and often contaminated by day-of-week effects. Run tests for a minimum of two complete weeks, preferably four.
Testing price in isolation. Price doesn’t operate in a vacuum. If you’re running a price test at the same time as a promotional email campaign, the test results are unusable. Freeze other marketing variables during a price test.
Using conversion rate as the only metric. A higher-priced product might convert less but generate more revenue per visitor. Always use revenue per visitor or contribution margin per visitor as your primary metric.
Ignoring the price elasticity of demand table over time. Elasticity changes. A product that is inelastic today can become elastic as competitors enter the market. Re-running your measurement quarterly is better practice than treating your initial calibration as permanent.
Conclusion: Price Elasticity as an Ongoing Practice
Price elasticity in e-commerce is not a one-time calculation — it’s an ongoing measurement discipline. The optimal price formula gives you a starting point, but real-world pricing strategy requires continuous input from market research, competitor monitoring, A/B testing, and demand signal analysis.
The brands that get pricing right share a few common practices: they monitor competitors continuously rather than periodically, they test prices before scaling them, they know their unit economics cold, and they treat their pricing elasticity model as a live document rather than a one-time output.
42Signals is built for exactly this workflow — giving brands the competitor pricing data, demand signal analytics, and market intelligence needed to calibrate pricing decisions in real time. Schedule a demo to find out.

Frequently Asked Questions
What is price elasticity of demand?
Price elasticity of demand is a measure of how sensitive consumer demand is to a change in price. It is calculated by dividing the percentage change in quantity demanded by the percentage change in price. A value greater than 1 means demand is elastic (sensitive to price); a value less than 1 means demand is inelastic (insensitive to price).
What is the difference between elastic and inelastic demand?
Elastic demand means a small change in price produces a large change in quantity demanded — typically because substitutes are available and the product is non-essential. Inelastic demand means quantity demanded is relatively unaffected by price changes — typically because the product is a necessity with no close substitutes.
What is the optimal price formula?
The optimal price formula is: Optimal Price = (Elasticity ÷ (Elasticity + 1)) × Marginal Cost. This is the Lerner pricing rule. It gives the revenue-maximizing price given your product’s price elasticity and your marginal cost of production and fulfillment.
How do I calculate price elasticity for my e-commerce products?
The most reliable method is A/B price testing: expose two cohorts of customers to different price points simultaneously, measure conversion rates and revenue per visitor, and calculate the implied PED. For a simpler starting estimate, use historical sales data: measure the percentage change in units sold in response to a past price change and divide by the percentage change in price.
What products have elastic demand?
Products with elastic demand include most fashion and clothing items, consumer electronics (especially non-flagship products), discretionary home goods, and any category where comparable alternatives are widely available. Price elasticity of demand for clothing, in particular, is consistently high due to the availability of substitutes and the non-essential nature of most purchases.
How does dynamic pricing relate to price elasticity?
Dynamic pricing is the application of price elasticity insights in real time. If your elasticity model tells you demand is currently low and inventory is high, dynamic pricing adjusts your price downward to stimulate volume. If demand is high and stock is tight, pricing moves up to protect margin. Without an elasticity calibration, dynamic pricing is guesswork.