Think about the last major brand crisis you witnessed online. How quickly did it explode? Reputation, painstakingly cultivated over years, can unravel in hours thanks to a single viral post or a cascade of negative reviews. That’s why a brand sentiment dashboard is so important.
To genuinely grasp your brand’s current health, not its historical state, you require a living, breathing Brand Sentiment Dashboard. This isn’t a luxury analytics toy; it’s your mission control, powered by continuous sentiment analysis and relentless brand monitoring, acting as both an early-warning radar and a strategic navigator.
In this article, we will look at building a practical, robust dashboard focused exclusively on real-time sentiment health. Forget vanity metrics. Let’s look at raw voice of customer analytics, deploy social listening across every relevant channel, implement sophisticated emotion tracking, and integrate deep review analytics – all visualized clearly within a dynamic sentiment dashboard designed for action.

Image Source: Rival IQ
Why Waiting is Fatal: The Case for Real-Time Brand Sentiment Vigilance

Image Source: Cision
Stop Crises Before They Ignite: Spot that sudden surge of negativity the moment it happens. Real-time detection gives your team precious minutes or hours to investigate and contain a potential PR wildfire. Early intervention isn’t just cheaper; it’s often the difference between a contained incident and a full-blown reputation meltdown.
Fix Customer Pain Points Before They Churn: Imagine identifying a brewing frustration about a product flaw or a service bottleneck as customers are experiencing it. Real-time insight empowers support, product, and marketing teams to jump in proactively. Turn simmering dissatisfaction into a demonstration of responsiveness, converting potential critics into loyal advocates.
Optimize Campaigns While They’re Live: Launched a big campaign or product? Don’t wait weeks for survey results. See immediately what’s landing well and what’s falling flat. Measure genuine audience resonance in real-time, allowing for rapid, data-driven tweaks while the campaign is still active, maximizing ROI on the fly.
Outmaneuver Your Competition: Your dashboard shouldn’t just watch you. Track competitor brand sentiment with the same intensity. Discover their hidden weaknesses and unexpected strengths revealed unfiltered through customer chatter.
Fuel Smarter Product Innovation: That steady stream of real-time voice of customer analytics isn’t just feedback; it’s your roadmap. See unmet needs, urgent feature requests, and genuine pain points bubbling up directly from users as they use your product. Let authentic customer insight guide your next development sprint.
Measure Reputation Health, Not Just Hype: Move beyond likes and shares. Establish a true baseline sentiment score and track tangible progress against strategic reputation goals in the moment. Real-time monitoring provides genuine, actionable indicators of brand health, not just superficial vanity metrics.
Core Components of a Real-Time Brand Sentiment Health Dashboard
Building an effective brand sentiment dashboard requires integrating several key elements:
1. Data Aggregation Engine: Casting the Widest Net
- Sources: Comprehensive brand monitoring requires pulling data from diverse sources:
- Social Media: Twitter (X), Facebook, Instagram, LinkedIn, TikTok, YouTube comments, Reddit, niche forums.
- Review Sites: Google My Business, Trustpilot, G2, Capterra, Yelp, App Stores (iOS/Android), industry-specific platforms.
- News & Blogs: Traditional media outlets, influential blogs, industry publications.
- Forums & Communities: Reddit, specialized forums (e.g., Stack Overflow for tech), Discord servers.
- Customer Support Logs: Zendesk, Intercom, Freshdesk transcripts (with permission/anonymization).
- Surveys: Real-time feedback widgets, post-interaction surveys (NPS, CSAT).
- Owned Media Comments: Blog comments, website feedback forms.
- Technology: Utilize APIs (Twitter API, Google My Business API, Review API providers like Yext or BirdEye, social listening platform APIs), web scraping (ethically and respecting robots.txt), and direct integrations with support/customer platforms. Robust data pipelines are essential.
2. Sentiment & Emotion Analysis Core: Beyond Positive/Negative
- Sentiment Analysis: The bedrock. Moving beyond simple polarity (Positive/Neutral/Negative) to:
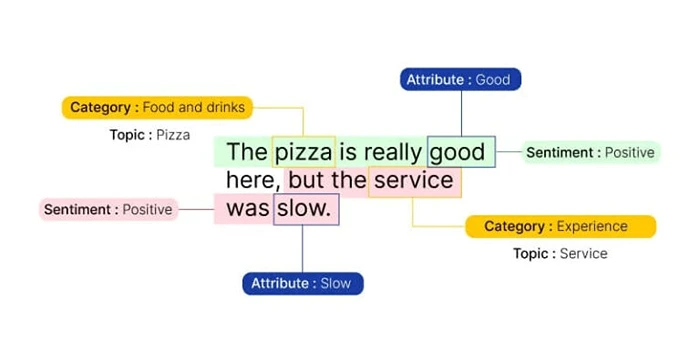
- Granularity: Aspect-based sentiment (e.g., sentiment about “battery life” vs. “camera” in a phone review).
- Intensity: Mildly positive vs. extremely positive; slightly negative vs. furious.
- Context Awareness: Understanding sarcasm, negation (“not bad”), and domain-specific language.
- Emotion Tracking: The next evolution. Detecting specific emotions expressed:
- Joy, Satisfaction, Excitement: Indicators of strong advocacy.
- Anger, Frustration: Urgent issues needing resolution.
- Disappointment, Sadness: Potential churn signals, unmet expectations.
- Confusion: Signifies unclear messaging or product complexity.
- Surprise: Can be positive (delight) or negative (shock).
- Technology: Leverage Natural Language Processing (NLP) and Machine Learning (ML) models. Options include:
- Vendor Solutions: Specialized sentiment analysis and emotion tracking APIs (e.g., 42Signals consumer sentiment analysis, Sprout Social Listening) often offer pre-trained models and continuous improvement.
- Open Source: Libraries like spaCy (with TextBlob or VADER for sentiment), NLTK, or Hugging Face Transformers (using models like BERT, RoBERTa fine-tuned for sentiment/emotion). Requires significant ML expertise.
- Custom Models: Training your own models on domain-specific data for the highest accuracy but highest cost/complexity. Crucial for niche industries or unique terminology.
3. Data Processing & Enrichment Layer: Adding Context
- Deduplication: Filtering out retweets, spam, and identical comments.
- Language Detection: Focusing analysis on relevant languages.
- Entity Recognition: Identifying brands, products, people, and locations mentioned.
- Topic Modeling/Keyword Extraction: Automatically categorizing conversations into themes (e.g., “Shipping,” “Pricing,” “Feature X,” “Customer Service”).
- Source & Author Metadata: Enriching data with source type, author influence (if available), location, etc.
- Custom Tagging: Applying business-specific tags (e.g., “Campaign_Summer24”, “Bug_Report”, “Feature_Request”).
4. Real-Time Processing Engine: The Heartbeat
This component continuously ingests new data, runs it through the analysis pipelines (sentiment, emotion, topics, entities), enriches it, and makes it available for the dashboard within seconds or minutes of its appearance online. Technologies like Apache Kafka (streaming), Apache Flink, or cloud-based solutions (AWS Kinesis, Google Pub/Sub) are often employed here.
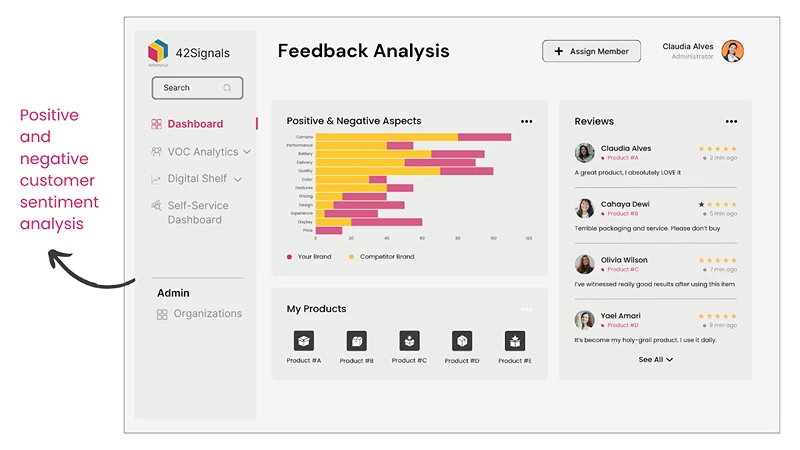
5. Visualization Dashboard: Making Insights Actionable (The Sentiment Dashboard)

- This is the user-facing interface where the synthesized data becomes insight. Key principles:
- Real-Time Updates: Visualizations must refresh automatically without manual intervention.
- Glanceability: High-level KPIs are visible at a glance.
- Drill-Down Capability: Clicking on a chart element should reveal the underlying mentions.
- Customization: Different teams (Marketing, PR, Product, CX) need different views.
- Alerting: Configurable alerts for critical thresholds (e.g., sentiment drop > 20%, surge in anger mentions, high-volume negative spike).
Essential Visualizations for Your Sentiment Dashboard:
1. Overall Sentiment Health KPI:
- Metric: Net Sentiment Score (NSS) = ( % Positive Mentions – % Negative Mentions) OR a weighted average sentiment score (e.g., -1 to +1).
- Visualization: Large, prominent gauge, trend line chart (hourly/daily), comparison vs. previous period/competitors.
- The Goal: Immediate pulse check.
2. Sentiment Trend Over Time:
- Visualization: Line chart showing Positive, Neutral, Negative sentiment percentages (or NSS) over hours/days/weeks. Annotations for key events (campaign launch, product update, crisis).
- The Goal: Spot patterns, correlate with actions.
3. Sentiment & Emotion by Source:
- Visualization: Stacked bar chart or heatmap showing sentiment distribution (Positive/Neutral/Negative) and/or dominant emotion across key sources (Twitter, Reviews, Forums, News).
- The Goal: Understand where sentiment is strongest/weakest; prioritize channel response.
4. Volume & Sentiment of Key Topics:
- Visualization: Bubble chart or bar chart. X-axis = Topics (identified via modeling/keywords), Y-axis = Mention Volume, Bubble Size/Color = Average Sentiment/Emotion.
- The Goal: Identify high-impact issues (high volume + negative sentiment) or successful areas (high volume + positive).
5. Live Mention Feed (Filterable):
- Visualization: A continuously updating stream of mentions, displaying text, source, timestamp, computed sentiment/emotion score, and key topics/tags. Must allow filtering by sentiment, emotion, source, topic, keyword, and time.
- The Goal: Contextual understanding, rapid response initiation.
6. Review Analytics Summary:
- Visualization: Key metrics like Average Star Rating (vs. competitors), distribution of star ratings, sentiment trend within reviews, top positive/negative review snippets (aspect-based).
- The Goal: Direct insight from structured feedback; identify drivers of satisfaction/dissatisfaction.
7. Competitor Sentiment Comparison:
- Visualization: Side-by-side gauges or trend lines for your NSS vs. key competitors.
- The Goal: Benchmarking performance, identifying relative strengths/weaknesses.
8. Emotion Distribution:
- Visualization: Pie chart or bar chart showing the proportion of mentions expressing key emotions (Joy, Anger, Frustration, Confusion, etc.). Filterable by time/source/topic.
- The Goal: Understand the emotional undertones of conversations; prioritize high-intensity negative emotions.
Quick Reference: Key Brand Sentiment Metrics to Monitor
A robust brand sentiment dashboard tracks more than just positive/negative percentages. Here are the essential brand sentiment metrics that should appear on your dashboard:
| Metric | Definition | Why It Matters |
| Net Sentiment Score (NSS) | (% Positive Mentions – % Negative Mentions) | Single‑pulse indicator of overall brand health |
| Sentiment Volume | Total mentions over time; can be broken by source (social, reviews, forums) | Helps contextualize score changes – a 10% drop in score with 5 mentions is different from 500 mentions |
| Emotion Distribution | Percentage of mentions expressing joy, anger, frustration, disappointment, confusion, surprise | Reveals the emotional undertone; anger and frustration are leading indicators of churn or crisis |
| Aspect‑Based Sentiment | Sentiment attached to specific topics (e.g., “shipping”, “customer service”, “battery life”) | Pinpoints exactly what’s driving positive or negative perception |
| Sentiment by Source | Breakdown of sentiment across Twitter, Reddit, Reviews, News, etc. | Shows where your brand is winning and where you need to focus crisis management or PR |
| Competitor Sentiment Gap | Your NSS vs. key competitors, often displayed as a comparative gauge or trend line | Benchmarks your reputation health; identifies relative strengths and weaknesses |
| Alert Triggers | Custom thresholds (e.g., sentiment drop >20% in 1 hour, anger mentions >50 in 24h) | Automates early warning so your team can intervene before a situation escalates |
| Response Rate & Time | How quickly you reply to negative mentions, and percentage of negative mentions addressed | Demonstrates customer‑centricity; can turn detractors into advocates |
How to Monitor Competitor Brand Sentiment
A complete brand sentiment dashboard shouldn’t only watch your own brand. Tracking competitors’ sentiment via customer feedback analysis gives you strategic intelligence.
Here’s how to incorporate competitor monitoring:
1. Identify Your Competitor Set
Include direct competitors, indirect players, and aspirational brands. For each, you’ll need to collect mentions using the same data sources you use for your own brand.
2. Use a Unified Platform
Choose a tool that supports multi‑brand tracking. 42Signals, for example, allows you to add competitor brands as separate “subjects” so you can compare sentiment, volume, and emotion side by side. It also provides share of search analytics which can be helpful to understand performance.
3. Benchmark Against Key Metrics
Your dashboard should display:
- Competitor Net Sentiment Score – Gauge your relative standing.
- Competitor Emotion Distribution – Are they generating more joy? More frustration?
- Topic Overlap – Which topics drive sentiment for them? Compare to yours.
- Share of Voice – How much of the overall conversation belongs to each brand.
4. Set Competitor Alerts
Create alerts for significant changes in competitor sentiment. A sudden spike in negative sentiment for a rival could mean an opportunity to capture their unhappy customers.
5. Use Insights to Shape Strategy
If a competitor consistently receives negative feedback about a specific feature, highlight your superior offering in marketing. If they excel at customer service, study what they do and adapt.
Building Your Dashboard: A Step-by-Step Blueprint
1. Define Objectives & KPIs:
- What key questions must the dashboard answer? (e.g., “Is sentiment dropping on Twitter?”, “What’s driving negative reviews?”, “How did our latest launch impact perception?”)
- What are your core health metrics? (e.g., NSS, Volume of Negative Mentions, Average Review Rating, Emotion Intensity Index).
- Identify stakeholders and their specific needs (PR needs crisis alerts, Product needs feature feedback).
2. Select Your Data Sources:
- Prioritize sources based on relevance to your audience and business. Don’t boil the ocean initially; start critical and expand. Ensure reliable access (APIs, partnerships).
3. Choose Your Analysis Engine:
- Vendor Route: Perform consumer sentiment analysis and emotion tracking providers. Key criteria: Accuracy (ask for demos with your data), language coverage, real-time capabilities, aspect-based analysis, API reliability & speed, cost. Popular choices include 42Signals’ voice of customer analytics feature.
- Open Source/Custom Route: Only recommended with strong in-house Data Science/NLP expertise. Requires significant investment in model training, validation, and infrastructure maintenance.
4. Design the Data Pipeline:
- Architect how data flows: Collection (APIs, scrapers) -> Ingestion (Message Queues like Kafka) -> Processing (Sentiment/Emotion Analysis, Enrichment – using chosen engine) -> Storage (Optimized databases like Elasticsearch, ClickHouse, or cloud data warehouses like BigQuery, Snowflake) -> Dashboard (via BI tools or custom front-end).
5. Select a Visualization Platform:
- Business Intelligence (BI) Tools: Power BI, Tableau, Looker Studio. Pros: Powerful visualization, familiar to analysts, good for static reports. Cons: Real-time streaming can be clunky, less suited for live feeds, and may require a data warehouse.
- Data Visualization Libraries: D3.js, Plotly, Highcharts (custom development). Pros: Maximum flexibility, seamless real-time updates, tailored UX. Cons: Requires front-end development resources.
- Social Listening/BI Hybrids: Some enterprise social listening platforms (42Signals) have built-in, highly customizable dashboards designed specifically for this data. Often, the most integrated solution.
6. Develop the Dashboard Interface:
- Focus on user needs. Group related visualizations logically.
- Implement real-time streaming updates for key metrics and the mention feed.
- Build robust filtering capabilities (time, source, sentiment, emotion, topic, keyword, custom tags).
- Set up alerting mechanisms (email, Slack, SMS) based on configurable thresholds.
7. Implement & Test Rigorously:
- Integrate all components. Test data flow, analysis accuracy (validate sentiment/emotion tags manually on a sample), visualization refresh rates, and alert triggers extensively.
- Conduct user acceptance testing (UAT) with stakeholders.
8. Deploy, Monitor & Iterate:
- Launch to users with training.
- Continuously monitor pipeline health and analysis accuracy. Retrain models as language evolves.
- Gather user feedback and iterate on the dashboard – add new data sources, visualizations, or alerts as needs evolve.
Critical Considerations & Pitfalls to Avoid in Brand Sentiment Analysis
Accuracy is Paramount: Garbage in, garbage out. Poor sentiment analysis or emotion tracking renders the dashboard useless, even dangerous. Continuously validate results. Understand the limitations of NLP (sarcasm, nuance, emerging slang).
Context is King: Never rely solely on a sentiment score. The live feed and drill-down capabilities are essential to understand why sentiment is shifting. A negative mention about a competitor in your feed is very different from one about your product.
Actionability: The dashboard must drive decisions. Define clear workflows: Who gets alerted? Who investigates? Who responds? How is the feedback looped to Product/Marketing?
Avoid Alert Fatigue: Over-alerting leads to ignored alerts. Make alerts highly specific and actionable (e.g., “Negative mentions about ‘delivery delays’ on Twitter increased by 50% in the last hour”).
Data Privacy & Compliance: Ensure data collection and storage comply with GDPR, CCPA, and platform terms of service. Anonymize personal data where necessary.
Cost Management: Real-time processing and large data volumes can be expensive. Optimize data collection (avoid unnecessary sources initially), processing, and storage. Choose tools wisely.
Beyond Social: Integrate review analytics and voice of customer from support and surveys for a holistic view. Social is loud, but reviews and direct feedback are often more detailed and impactful.
Human Oversight: The dashboard is a tool, not a replacement for human judgment. Context, nuance, and strategic response require human intelligence.
Advanced Enhancements
Predictive Analytics: Use historical sentiment, emotion, volume, and external data (e.g., stock price, news trends) to build models predicting potential crises or identifying emerging positive trends.
Influencer Impact Tracking: Identify key influencers driving sentiment (positive or negative) and measure their impact.
Integration with CRM/Support Systems: Automatically create support tickets or alert account managers based on negative sentiment from key customers identified in the feed.
Multilingual & Cross-Cultural Nuance: Implement region-specific models to account for cultural differences in sentiment expression.
Top Tools for Real-Time Brand Sentiment Analysis (Quick Comparison)
| Tool | Best For | Real‑Time | Emotion Tracking | Competitor Comparison | API / Integrations |
| 42Signals sentiment analysis tools | E‑commerce & general brand monitoring | Yes | Yes | Yes | Yes (Zapier, Slack, CRM) |
| Sprout Social | Social media focus | Yes | Limited | Yes | Yes |
| Brandwatch | Enterprise, deep NLP | Yes | Yes | Yes | Yes |
| Talkwalker | Visual & real‑time alerts | Yes | Yes | Yes | Yes |
| Meltwater | Media & social monitoring | Yes | Basic | Yes | Yes |
| Open Source (spaCy, Hugging Face) | Custom in‑house builds | Depends on pipeline | Possible | Requires development | Custom |
Conclusion: Building a Sentiment Dashboard That Drives Decisions, Not Just Reports
Building a real-time Brand Sentiment Dashboard is a significant investment, but it’s an investment in your brand’s most valuable asset: its reputation and relationship with customers. Moving from reactive scrambling to proactive health monitoring transforms how you understand and engage with your audience.
Ready to see a brand sentiment dashboard in action without building it from scratch? 42Signals’ Voice of Customer Analytics 42 Signals provides real-time sentiment monitoring, emotion tracking, competitor comparison, and aspect-based review analytics — all in a single pre-built dashboard. Book a demo and we’ll show you live sentiment data for your brand and your top two competitors.
Sign up for a free trial today and see it for yourself.
Frequently Asked Questions (FAQs) on Real-Time Brand Sentiment Tracking
1. What are the best tools for real‑time brand sentiment analysis?
Leading platforms include:
42Signals – Combines social listening, review analytics, and emotion tracking with custom dashboards.
Sprout Social – Strong in social listening and sentiment analysis.
Brandwatch – Enterprise‑grade with advanced NLP and real‑time alerts.
Talkwalker – Real‑time monitoring with image recognition.
Meltwater – Media monitoring with sentiment analysis.
Open Source – Libraries like spaCy, VADER, or Hugging Face for teams with data science expertise.
2. How can I set up real‑time sentiment analysis and alerts when our brand is mentioned?
Follow this process:
Choose a platform that offers real‑time ingestion (e.g., 42Signals, Brandwatch).
Define keywords – your brand name, product names, common misspellings.
Set up data sources – social media APIs, review platforms, news feeds.
Configure alerts – e.g., “Notify Slack when negative sentiment spikes >20% in 1 hour.”
Test and refine – adjust thresholds to avoid alert fatigue.
3. How can I monitor brand sentiment in real‑time across AI platforms (like ChatGPT or Perplexity)?
AI platforms are emerging sources of brand mentions. To track sentiment there:
Use platforms that monitor AI‑generated content via web scraping or API (e.g., 42Signals’ AI monitoring features).
Set up alerts for brand mentions in AI responses (often captured by scraping forums or using specialized APIs).
For Slack integration, use webhooks from your sentiment tool to push alerts directly to a designated channel.
4. What are reliable ways to measure online sentiment for luxury real estate brands?
Luxury real estate requires a nuanced approach:
Focus on high‑value sources: Forbes, The Real Deal, industry blogs, Instagram, LinkedIn, and private community forums.
Use emotion tracking – excitement, prestige, trust are more relevant than simple positive/negative.
Monitor influencer content – agents, architects, and influencers often shape perception.
Integrate review sites – Google My Business, luxury travel sites, and agent review platforms.
5. How do I track sentiment during product launches?
Create a dedicated dashboard view for the launch period.
Set baseline sentiment one week before launch.
Monitor real‑time volume, sentiment, and emotion across launch day and the following week.
Correlate with specific events – ads, influencer posts, press coverage.
Use aspect‑based sentiment to capture feedback on specific features or messaging.
6. How can I compare brand sentiment vs. competitors?
Choose a platform that supports multi‑brand tracking.
Visualize side‑by‑side using gauges, trend lines, or heatmaps.
Compare share of voice and sentiment by topic.
Set competitor alerts to detect when a rival experiences a sentiment shift.
7. What should I monitor weekly to keep brand sentiment healthy across chatbots?
Sentiment scores from chatbot transcripts (if integrated with analytics).
Escalation rates – how often a user asks for a human agent.
Emotion trends – frustration or confusion detected in interactions.
Recurring topics – common questions or complaints.
Response time and resolution – how quickly issues are resolved.
8. Is brand sentiment a KPI?
Absolutely. It’s a leading indicator of customer loyalty, market share, and brand equity. Many organizations include it in executive dashboards alongside traditional KPIs like NPS, revenue, and churn.
9. How do I measure changes in brand sentiment over time?
Use trend lines for Net Sentiment Score, positive/negative percentages, and emotion distribution.
Annotate the timeline with key events (campaigns, product launches, press releases).
Calculate sentiment deltas (e.g., week‑over‑week, month‑over‑month).
Compare to industry benchmarks to gauge relative movement.
10. What’s the best way to get a live feed of brand sentiment for a supervisor dashboard?
Use a dedicated social listening tool with a real‑time feed widget (42Signals, Sprout, etc.).
Integrate with Slack or Teams for instant alerts.
Build a custom dashboard using BI tools (Power BI, Tableau) with streaming data from your sentiment engine.
Set up negative sentiment alerts that trigger a push notification to supervisors.