In 2023, Amazon reported that sellers using advanced analytics tools grew revenue 2.3x faster than those relying on intuition alone. Yet, despite the $6.3 trillion global ecommerce market, fewer than 15% of brands fully capitalize on performance data to drive strategic decisions and optimize execution. The gap between winners and laggards? A disciplined approach to ecommerce performance analytics—a strategy that transcends dashboards by blending digital shelf intelligence, MAP compliance enforcement, and hyper-targeted quick commerce innovations.

This isn’t about chasing vanity metrics or superficial KPIs. It’s about engineering a sustained 30% revenue surge by converting raw, fragmented data into high-leverage profit mechanisms.
Let’s break down how ecommerce leaders like Brooklinen, Gymshark, and agile upstarts are redefining growth.
Ecommerce Performance Analytics: Beyond the Basic Dashboard

Most brands track conversion rates and average order value, but that’s like using a sundial to navigate a spaceship through a digital cosmos. True analytics fluency requires combining three critical data pillars:
- Behavioral Data: Understand exactly where users click, hover, hesitate, or abandon—at both session and cohort levels.
- Competitive Data: Capture shifts in pricing, monitor out-of-stocks at key rivals using competitive tracking, and surface emerging keyword trends before they peak.
- Operational Data: Dive deep into fulfillment costs, return rates by SKU, and pinpoint MAP violation hotspots that drain margin.
Case Study: Pet food brand KibbleCo used Hotjar heatmaps to uncover that 62% of mobile users were scrolling past their high-margin premium line. After repositioning the products above the fold and introducing urgency triggers like “Only 3 Left!”, mobile conversions surged by 41% over just 8 weeks.
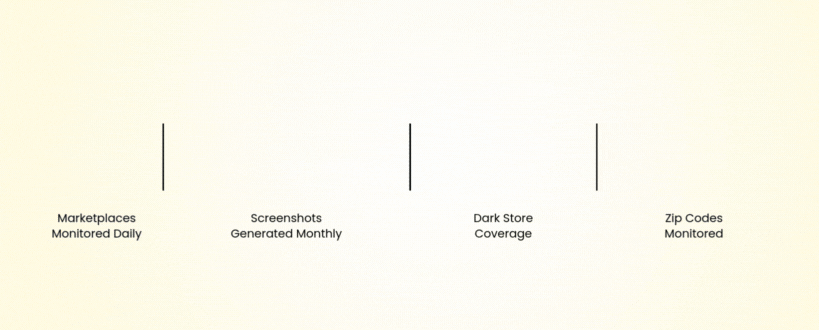
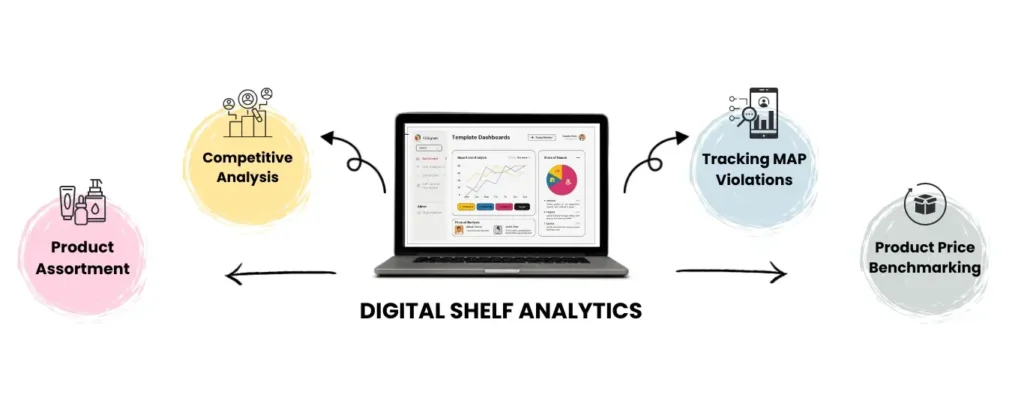
Digital Shelf Analytics: Claiming Your $2.4M Visibility Windfall
The digital shelf—your products’ presence across ecommerce platforms—is where over 83% of purchase decisions are made (Mirakl, 2023). Yet 56% of listings are under-optimized, costing brands millions in lost visibility.
Digital shelf analytics tackles questions like:
Are You Winning the ‘Share of Search’ War?
If your product appears in just 12% of Amazon or Google searches for “organic protein powder” while competitors dominate with 35%, your visibility gap is costing real dollars. Platforms like 42Signals can help close this gap.

Is Your Content Compliance Killing Sales?
According to a 2024 Feedonomics study, 28% of Walmart listings are delisted monthly due to content violations. Proactive audits prevent this from spiraling.
Tactical Move: Skincare brand GlowLab leveraged ShelfTrend to identify inconsistencies in 73% of their Amazon listings. After cleaning up bullet points and images, their “share of search” for “vitamin C serum” jumped from 9% to 22%, generating $1.8M in incremental revenue annually.
MAP Violations: The Silent Profit Killer (and How to Slay It)
Minimum Advertised Price (MAP) violations aren’t just the fault of rogue sellers—automated repricing tools frequently trigger violations unknowingly. Even a single breach can erode profit margins by 9–15% (Vendavo, 2024).
The Fix:
- Use tools like 42Signals that alert you when there’s a price violation on your products across platforms.
- Automate enforcement workflows to issue warnings and takedown notices within 24 hours.
- Incentivize compliance with benefits like co-op advertising funds or early access to stock.
Real Result: Audio gear brand SonicWave cut MAP violations from 37% to just 4% of SKUs, reclaiming over $480,000 in annual margin leakage.
Competitor Tracking: Espionage Meets Economics
Competitor tracking isn’t corporate espionage—it’s smart economics. Tools 42Signals gives you a comprehensive insider view of your rivals’ tactics in near real time by letting you understand –
- Pricing Patterns: Detect trends like Competitor X slashing prices daily after 3 PM, and dynamically adjust your pricing strategy.
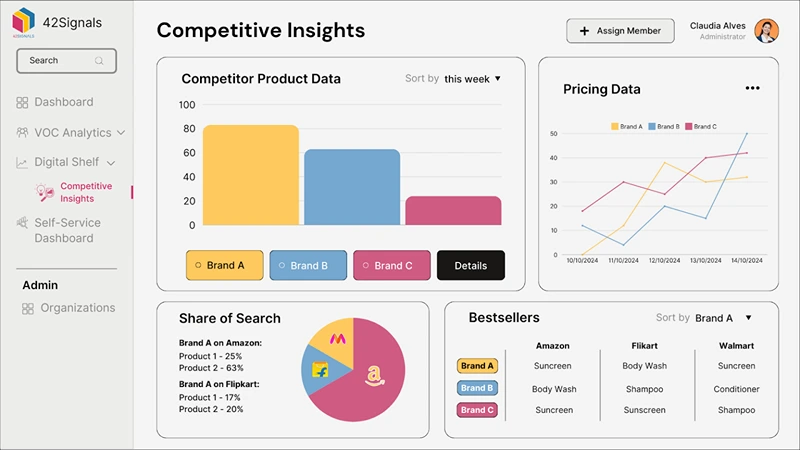
- Inventory Alerts: If Target is out of Dyson vacuums, boost your visibility for similar products on Google Shopping instantly.
- Promo Calendars: Reverse-engineer your competitor’s seasonal playbook using the Wayback Machine or ad library archives.
- Bestseller Data: As a bonus, also track and understand competitors’ bestseller data to know what they’re doing well and what your brand can adopt.

Pro Tip: Beverage startup Zing spotted a competitor’s viral TikTok pairing “quick commerce” with hydration. They quickly partnered with GoPuff to launch 1-hour delivery and saw a 58% YoY sales spike.
Quick Commerce: The 10-Minute Delivery Tipping Point
Quick commerce has dramatically evolved in the past couple of years, changing consumer behavior permanently. Customers now require faster deliveries and a wide array of products to choose from that can meet their urgent grocery needs or non-essential shopping requirements.
- Micro-Warehousing: Lease compact urban fulfillment centers—like Fabric’s micro-nodes—for your top-performing SKUs.
- Dynamic Routing: Tools such as Bringg optimize routes based on real-time traffic, shaving off 8–12 minutes from average delivery time.
- Smart Bundling: Sell “Emergency Kits” (e.g., snacks + chargers) for late-night orders, boosting average order value.
Brand Example: Cosmetics brand RushBeauty stocked their 50 top sellers in Darkstore micro-fulfillment hubs. Their “90-Minute Glow” campaign turned 29% of first-time customers into loyal subscribers.
Share of Search: Understanding the Online Marketplace
Share of search—the percentage of queries your brand appears in—predicts up to 74% of market share shifts, according to Google (2023). Dominating it requires intent-driven tactics:
- Answer ‘Why’ Questions: Build content targeting high-intent queries like “why choose [your brand] over [competitor].”
- Hijack Competitor Keywords: Use paid ads and landing pages that compare features, pricing, and benefits directly.

- Leverage UGC: Encourage TikTok unboxings and Instagram stories with branded hashtags—user-generated content ranks up to 3x faster.
Case Study: Furniture brand UrbanNest noticed a 12% search share for “small space desk.” By engaging studio apartment influencers, they boosted it to 31%, driving $2.2M in new revenue.
The 5-Step Roadmap to 30% Growth
1. Diagnose Leaks: Conduct a 30-day deep audit using tools like Littledata or TripleWhale to find bottlenecks and blind spots.
2. Prioritize High-ROI Fixes: Tackle abandoned cart issues before optimizing upsell flows or advanced personalization.
3. Build a War Room: Form a cross-functional team—marketing, ops, legal—that meets weekly to dissect analytics and act fast.
4. Pilot-Test Innovations: Test bold strategies like q-commerce or MAP policing in one market before rolling them out company-wide.
5. Negotiate with Data: Bring hard performance data to the table during retailer or distributor negotiations to improve terms.
From Data Drowning to Profit Soaring
The brands consistently hitting 30%+ growth are all using analytics to back their strategies. By mastering digital shelf analytics to dominate search results, automating MAP compliance to protect margins, and embedding q-commerce into last-mile strategies, these companies are rewriting the ecommerce rulebook.
Try 42Signals for free to see how we can fit your brand’s needs.