Key Takeaways for Marketplace Revenue Estimation
Before we dive into the details, it is helpful to have a summary of how modern brands approach this challenge. This revenue estimation process focuses on turning public signals into private insights that help you win more market share.
- The core of the process involves tracking four main signals which include the product price, the sales rank, the volume of new reviews, and the availability of stock. By monitoring these over time, you can create a fairly accurate model of how many units a competitor is moving each month without ever seeing their internal spreadsheets.
- Advanced data layers like 42Signals automate this entire workflow so that you do not have to manually scrape pages or guess at numbers. Our platform acts as the underlying intelligence layer that translates raw marketplace data into directional revenue estimates, allowing category managers to see where the real opportunities lie.
- Understanding category revenue is just as important as tracking individual rivals because it shows you the total ceiling for your products. If you know the total size of the pie, you can better justify marketing spend or new product launches to your leadership team.
Introduction to the Revenue Estimation Challenge
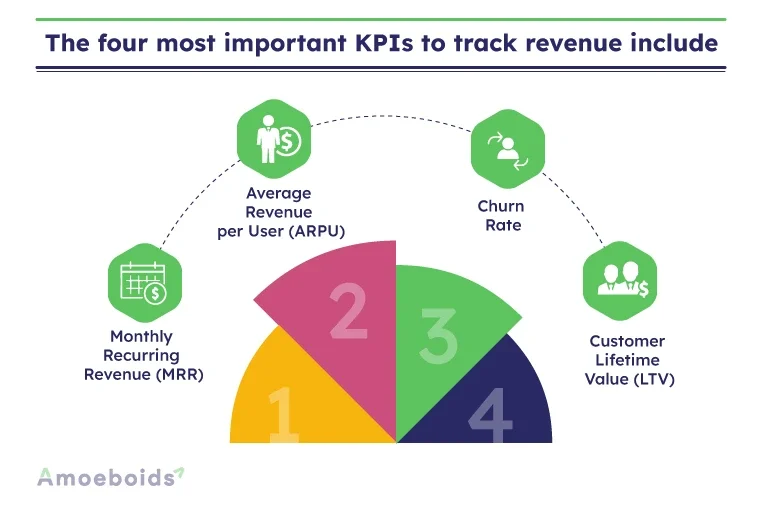
Image Source: Amoeboids
If you are a brand manager or a category lead, you know the feeling of looking at a competitor’s product page and wondering exactly how much they are making. You can see their beautiful images and their thousands of reviews, but the most important number is hidden. Marketplaces like Amazon, Blinkit, and Zepto do not just hand out sales data to everyone. This lack of transparency creates a major problem for brands trying to plan their growth or enter new categories. Without an accurate revenue estimation, you are essentially flying blind in a very crowded sky.
The good news is that while the exact sales numbers are private, the signals that lead to those sales are public. Every time a product sells, its rank changes. Every time a customer is happy or mad, they might leave a review. These small digital breadcrumbs can be gathered and analyzed. This article will show you how to turn those signals into a powerful ecommerce revenue estimation that changes how you view your market.
The Problem With Private Sales Numbers
The biggest hurdle in the digital shelf space is that you only have a view of your own performance. You know your conversion rates and your daily GMV, but you have no baseline to compare it against. This makes it impossible to know if you are winning or losing. If your sales grew by 10 percent but the category grew by 50 percent, you are actually losing ground. This is why competitor revenue tracking is not just a nice tool to have, it is a survival requirement.
Most brands try to solve this by buying expensive market reports that are often months out of date. By the time you read a report from last quarter, the market has already moved on. You need something that works in near real time. You need a way to look at the current state of the marketplace and work backward to the sales volume. This is where professional sales volume modelling comes into play, turning the chaos of the marketplace into a structured data set.
Primary Signals for Ecommerce Revenue Estimation
To build a solid model, we have to look at the factors that correlate most closely with sales. We call these marketplace signals. When you combine them, they provide a multi dimensional view of a product’s health.
Using Sales Rank as a Foundation
The most common way to start an amazon revenue estimator model is by looking at the Best Sellers Rank or BSR. This number is updated frequently and tells you exactly how a product is performing relative to others in its category. A lower number means higher sales. However, rank is not a linear thing. The jump from rank 10 to rank 5 is much larger in terms of units than the jump from rank 100 to 95.
To make sense of this, you need a rank to sales calculation that accounts for the specific category. A rank of 100 in Electronics is vastly different from a rank of 100 in Industrial Supplies. Professional tools track thousands of products to build curves that map these ranks to specific unit counts. This allows you to estimate that a product at a certain rank is likely selling a specific number of units per day.
Tracking Review Velocity
Review velocity is the speed at which a product gains new reviews over a specific period. Review velocity tracking is one of the most reliable ways to perform a marketplace sales estimation because it is very hard to fake at scale. While not every buyer leaves a review, a consistent percentage of them usually do. Industry data suggests that on marketplaces like Amazon, the average review rate is often between 1 percent and 2 percent of total orders.
If you notice a competitor has gained 50 reviews in the last month, you can use a multiplier to guess their total sales volume. For example, if you assume a 2 percent review rate, those 50 reviews could represent roughly 2,500 sales. You must also account for the fact that some brands use automated tools to ask for reviews, which can slightly inflate this number. However, when combined with other signals, it remains a pillar of revenue estimation.
Monitoring Price Movements and Discounting
Price is a direct lever for revenue. You cannot calculate GMV without knowing the final price the consumer paid. This is why price movements and MAP violation monitoring are your earliest competitive signal. If a competitor drops their price by 20 percent, you can expect their sales rank to improve shortly after.

By tracking these changes daily, you can see how sensitive the category is to pricing. Some products see a huge spike in revenue estimation when they offer a small discount, while others stay flat. This data helps you decide if you should engage in a price war or if you should maintain your margins. Knowing the average selling price over a month is crucial for accurate sales volume modelling.
Availability and Stock Levels
Availability is the most overlooked signal. You can have the best product in the world, but if it is out of stock, your revenue drops to zero instantly. Tracking the out of stock or OOS rate of your competitors gives you a clear view of their supply chain health. If a top rival is constantly out of stock in Mumbai but available in Delhi, there is a regional opportunity for you to swoop in and take their customers.
There is also a technique known as the 999 method for inventory tracking. This involves adding 999 units of a product to a cart to see how many the system allows you to purchase. If it says only 45 are available today and 30 are available tomorrow, you know they sold 15 units. While some platforms have blocked this, advanced data layers can still use similar logic to monitor stock depletion over time.
Translating Signals into Directional Revenue Estimates
Once you have gathered the data on rank, reviews, price, and stock, you have to put it all together. This is where the math happens. You are not just looking for a single number, you are looking for a trend. A single day of high sales could be a fluke or a one time promotion. A month of high sales is a pattern.
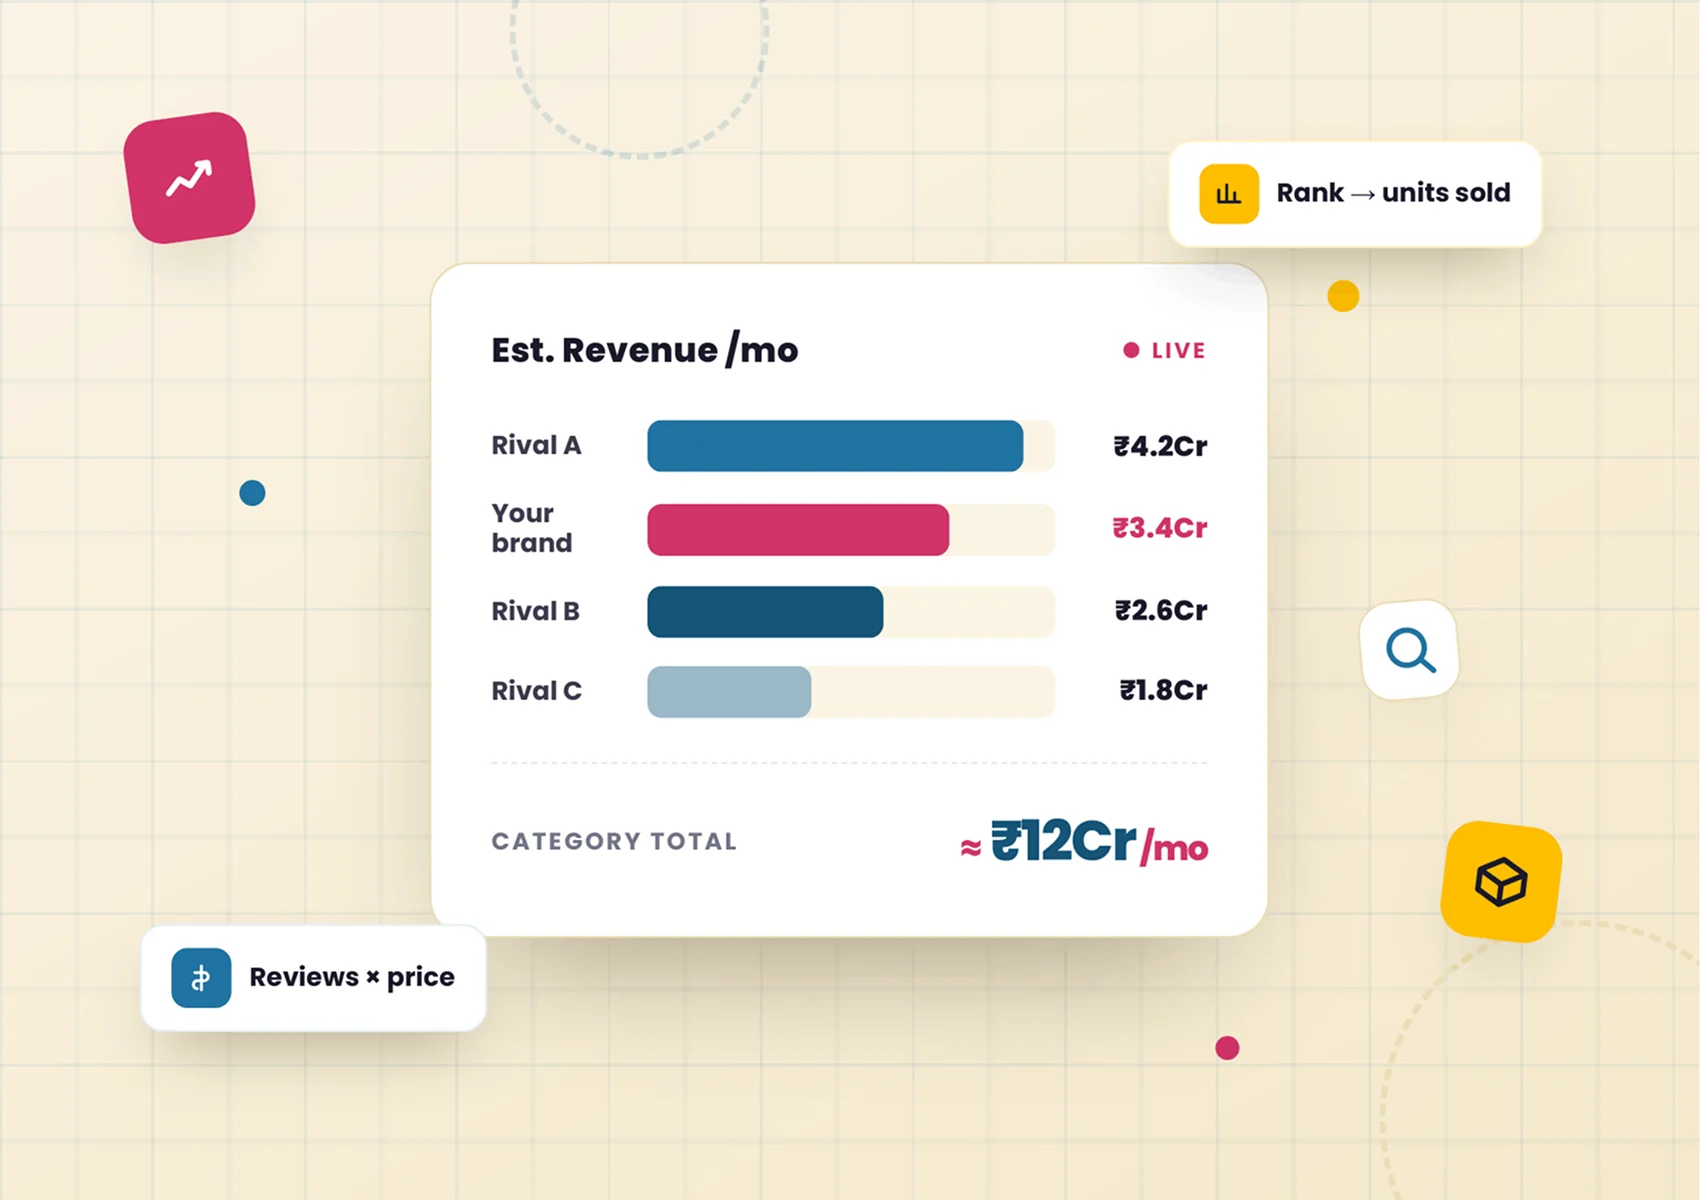
Directional revenue estimates are meant to give you the “what” and the “how much” so you can make “why” decisions. If your model shows a competitor is making 500,000 dollars a month in a specific sub category, you can compare that to your own 100,000 dollars. This tells you that there is a 400,000 dollar gap that you could potentially close. It helps you prioritize which products to launch next.
Modeling Category Revenue and Market Share
Beyond just looking at one competitor, you should look at the entire category. This is called category revenue analysis. By aggregating the estimated sales of the top 50 or 100 products in a niche, you can see the total addressable market. This is the only way to truly calculate your market share.
If the total category revenue is 10 million dollars and you are doing 1 million, you have a 10 percent market share. Knowing this allows you to set realistic goals. It also helps you identify “movers and shakers.” These are smaller brands that might not be in the top 5 yet but are growing their revenue estimation at a 50 percent monthly rate. Catching these trends early allows you to react before they become a major threat.
The Role of 42Signals as a Data Layer
Building these models by hand is nearly impossible for a modern brand with hundreds of SKUs. You need a partner that can handle the heavy lifting of data collection and cleaning. This is why we position 42Signals as the essential data layer for your ecommerce strategy. We don’t just give you raw data, we give you the infrastructure to understand it.
Our platform provides PDP analytics that track every detail of the digital shelf. This includes dark store level availability for quick commerce tracking and national level tracking for major marketplaces. We provide the commercial anchors you need to justify your budget and the tactical insights you need to win the day. By using our revenue estimation models, you can move from guessing to knowing.
Turning Revenue Estimates Into Product and Pricing Decisions
The ultimate goal of all this tracking is growth. When you have a clear view of the money flowing through your category, your strategy becomes much sharper. You can stop wasting money on keywords that don’t convert and start investing in the areas where your competitors are weak.
You might find that a competitor has a high revenue estimation but very low ratings. This is a massive opportunity. It means there is high demand but low satisfaction. You can launch a better version of that product and use the same keywords to steal their market share (learn more about this with share of search analytics). Without the revenue data, you might have assumed their high review count meant they were untouchable. The data shows you the truth.
Common Pitfalls to Avoid in Competitor Tracking
While the methods described here are powerful, they are not perfect. It is important to understand the limitations of any revenue estimation model. No model can account for 100 percent of the variables, such as private bulk orders or off platform sales.
You should also be careful about seasonal spikes. A massive jump in sales during Diwali or Black Friday is normal and does not necessarily mean a brand has found a secret strategy. Always look at year over year data to see the real growth. Additionally, do not rely on just one signal. If you only look at rank, you might miss the fact that the brand is selling at a 90 percent discount and making zero profit. Always look at the combination of price and volume.
Conclusion: Mastering Your Revenue Estimation Strategy
In the world of ecommerce, information is the most valuable currency. Brands that have a clear view of competitor and category performance are the ones that survive and thrive. By using marketplace signals like price, rank, review velocity, and availability, you can build a robust revenue estimation that guides your every move.
You no longer have to wonder what is happening behind the closed doors of your rivals. With the right data layer, those doors are wide open. Whether you are using an amazon revenue estimator, Amazon competitor tracking or building a custom model for quick commerce, the principle remains the same.
Track the signals, model the volume, and act on the insights. If you are ready to take control of your market share and stop flying blind, it is time to invest in a professional data strategy with 42Signals that puts revenue estimation at the heart of your business.
Frequently Asked Questions
What is the most accurate way to do revenue estimation?
The most accurate way is to combine multiple signals such as sales rank, review velocity, and inventory changes. No single signal is perfect, but when they are used together in a professional sales volume modelling system, the directional accuracy is very high. This helps brands understand the scale of their competitors without needing access to their private accounts.
Can an amazon revenue estimator work for other marketplaces?
While the logic of rank and reviews is similar across platforms, each marketplace has its own unique algorithm. An amazon revenue estimator needs to be calibrated differently than one for a quick commerce platform like Blinkit or Zepto. You must account for factors like regional availability and delivery speed which play a much larger role in quick commerce revenue estimation.
Why should I care about category revenue?
Category revenue tells you the total size of the market opportunity. If you only track your own sales, you might think you are doing well while actually losing market share to faster growing competitors. Knowing the total category size helps you set better KPIs and understand if a sales dip is a “you” problem or a “market” problem.
How often should I perform competitor revenue tracking?
Ideally, you should track these signals daily. Marketplace dynamics change very fast, and a competitor could run a promotion or go out of stock in a matter of hours. Daily tracking allows you to see these movements as they happen and react before the window of opportunity closes. Most professional brands use automated data layers to handle this constant monitoring.
Is ecommerce revenue estimation the same as GMV?
For most practical purposes, yes. Revenue estimation in this context usually refers to the Gross Merchandise Value or GMV generated by a product or category. It is the total value of goods sold before any expenses or returns are accounted for. This is the most common metric used to compare the relative strength of brands on a marketplace.