
How to Measure Share of Search: The Short Answer
Share of search is the proportion of visible search results your brand occupies, across a defined keyword set, relative to all brands competing for those terms.
The formula:
Share of Search (%) = (Your brand’s result placements ÷ Total placements measured) × 100
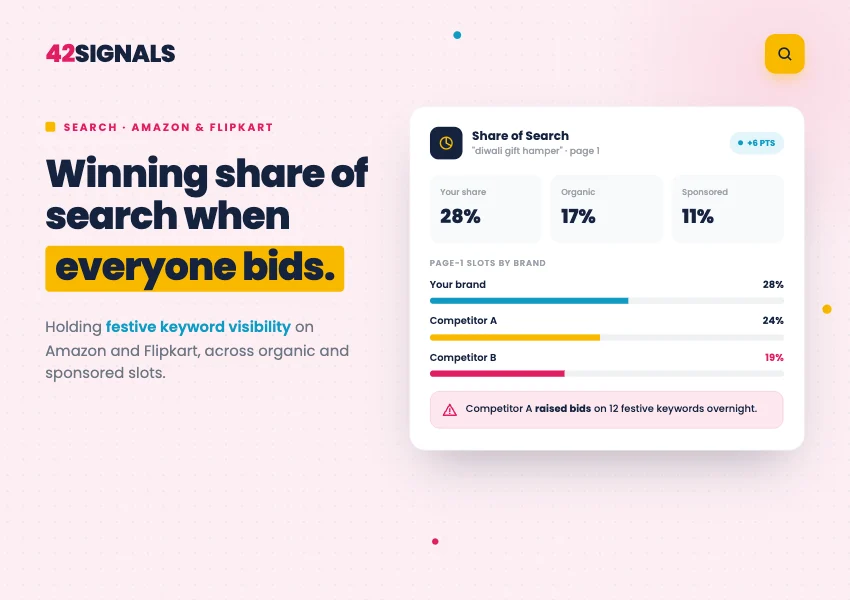
Measured across your priority keyword set, at a defined result depth, weighted by search volume, with organic and sponsored placements counted separately. That last clause is where most implementations go wrong. A brand reporting 30% share of search that turns out to be 8% organic and 22% bought is in a materially weaker position than one reporting 20% that is entirely organic — and a single blended number hides the difference completely. This guide covers the full methodology, why the organic and sponsored split matters more than the headline number, how Amazon and Flipkart differ, and what happens to the metric during festive windows when every competitor is bidding at once.
What Share of Search Actually Measures — and a Common Confusion
There are two distinct metrics using this name, and conflating them produces bad analysis.
Brand Share of Search (the Binet definition)
The original concept, popularised by Les Binet, Group Head of Effectiveness at adam&eveDDB, measures search volume: how many people search for your brand relative to all brands in your category, typically using Google Trends data.
Presenting at the IPA’s EffWorks Global 2020 conference, Binet tested the theorem across automotive, energy, and mobile phone handsets, finding that share of search correlated with market share in all three categories and functioned as a leading indicator: when share of search rises, market share tends to follow, and when it falls, market share falls. The lead time was substantial, up to a year in automotive.
Binet also identified the gap between the two, Extra Share of Search, as a particularly solid indicator of market share movement, and cautioned that it is not a perfect predictor, since conversion is affected by other factors, price in particular.
Subsequent research by James Hankins for the IPA, spanning 30 case studies across 12 categories and seven countries, found share of search accounted for approximately 83% of a brand’s market share.
Marketplace Share of Search
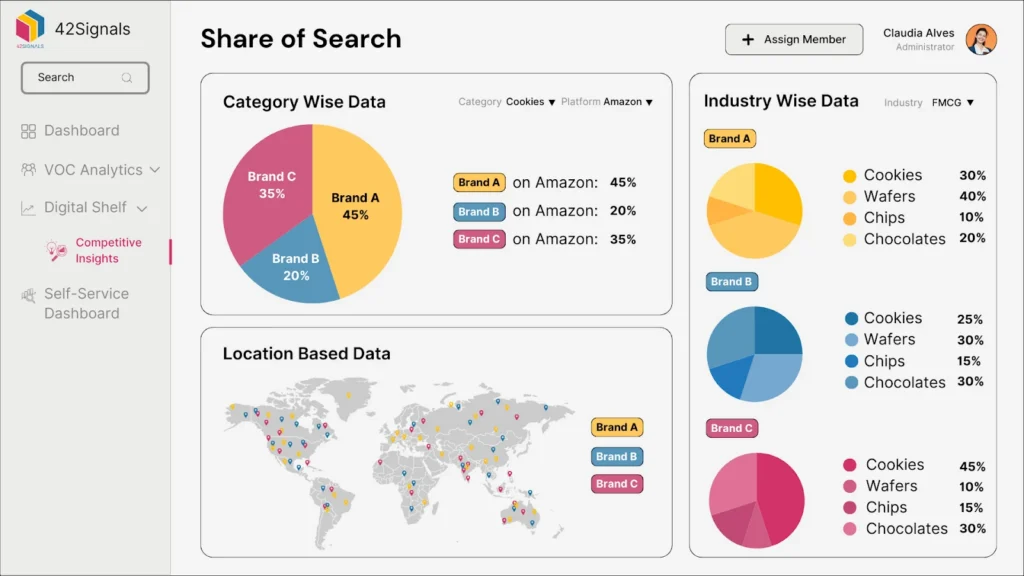
On Amazon and Flipkart, the useful version measures shelf occupancy: what proportion of the visible results for your category keywords your products occupy, versus competitors.
This is a different measurement with a different data source. It is closer to the share of voice on a physical shelf than to Binet’s brand-search metric.
Why the distinction matters: a great deal of ecommerce content borrows Binet’s research credibility to justify a metric his research did not test. The predictive relationship he documented is real, and it is about brand search volume on Google. Marketplace share of search is a valuable operational metric in its own right, as a first-page visibility measure and a leading indicator of category share, but claiming Binet’s 83% finding applies to it is not supportable.
The Five-Step Method
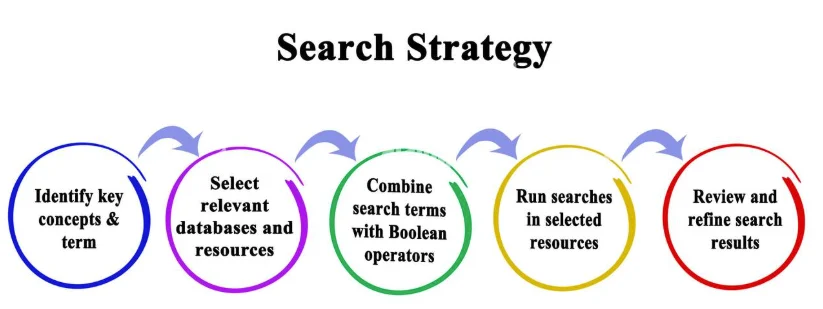
Image Source: Alamy
I think we need to have a proper cross-functional call for us between the 3 biz teams because right now the way stuff is, we don’t have any visibility into what’s going on in Product or Sales wrt to inbound leads or app signups.
What we see or know is from whatever has been implemented on our side, and we don’t get notes on what happens after the lead has come in.
To make this work like a proper loop where we make improvements, we actually need two-way communication and data so we know what happens after the lead comes in and you’ll know what led to that.
Step 1: Define Your Keyword Set
The keyword set determines everything downstream. Get this wrong, and no amount of measurement precision helps.
Include generic category terms — what shoppers search when they don’t have a brand in mind. These are where new customers are won and where share of search is most meaningful.
Include high-intent commercial terms with qualifiers: size, variant, use case, price framing.
Include competitor brand terms only as a separate tracked segment, never blended into the main set. They behave differently and will distort your trend line.
Exclude your own brand terms from the core measure. Your share of search on your own brand name should be near 100%, and including it inflates the metric while telling you nothing about category competitiveness. Track it separately as a brand-defence indicator.
A structured competitor keyword gap analysis is the right way to build this list, because it surfaces the terms rivals rank for that you don’t, the ones that never appear in your own reporting precisely because you’re absent from them.
Step 2: Set Your Result Depth
Decide how many results count as “visible” and hold it constant.
Top 10 is a reasonable default for Amazon and Flipkart desktop and app search. Top 20 gives a broader view of category presence. For quick commerce, where three or four products appear above the fold, top 5 or even top 3 is the only depth that reflects reality.
The number matters less than the consistency. Changing depth mid-measurement invalidates your trend.
Step 3: Weight by Search Volume
An unweighted average treats a term with 50,000 monthly searches identically to one with 300. That produces a number that moves for reasons unrelated to your commercial position.
Weight each keyword’s contribution by its search volume so your share of search reflects where demand actually concentrates. If volume data is unavailable, weight by a proxy, your own impression share, or category sales contribution.
Step 4: Separate Organic From Sponsored
This is the step that turns a vanity metric into a decision-making one.
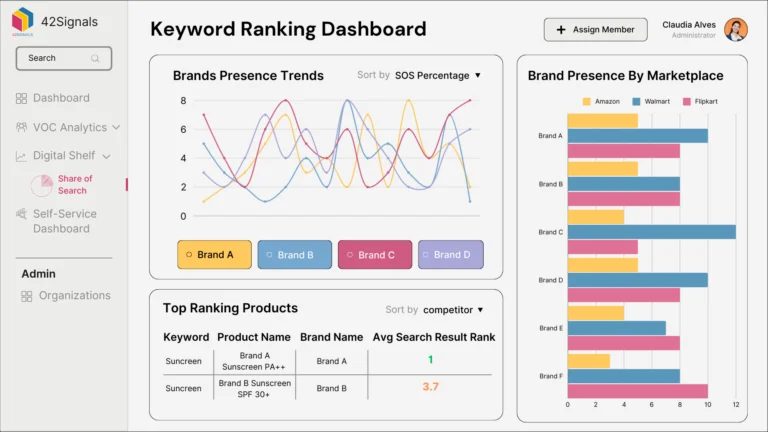
Count organic placements and sponsored placements as distinct measures. Then track the ratio between them over time. What you’re looking for:
Organic share rising: listing quality, availability, and conversion are working. The strongest position.
Paid share rising while organic falls: advertising is masking an underlying problem rather than solving it. Common, expensive, and invisible in blended reporting.
Both rising: genuine momentum.
Both falling: a competitor is taking the shelf.
Step 5: Set the Cadence
Weekly is sufficient for most categories outside peak. During a festive window, daily — the shelf reorganises fast enough that weekly measurement means finding out after it mattered.
Whatever cadence you choose, measure at the same time of day. Marketplace results vary through the day with stock, pricing, and bid changes, and inconsistent timing introduces noise you’ll mistake for signal.
Why the Organic and Sponsored Split Is the Whole Point
Here is the scenario that costs brands the most money, and it is completely hidden by a blended number.
A brand holds strong organic rank on its top ten category terms. It also bids aggressively on those same terms. Reported ROAS looks excellent because the shoppers converting were going to convert anyway; they’d have found the organic listing sitting directly below the ad.
The brand is paying to buy traffic it already owned.
The only way to see this is to compare paid share of search against organic share of search on the same terms. Heavy overlap means reallocating spend toward terms where organic visibility is weak is likely the fastest efficiency gain available — often a larger improvement than any bid optimisation.
Share of Search as a Leading Indicator
The commercial case for measuring share of search at all is that it moves before sales do.
Sales data tells you what happened. Share of search tells you what is about to happen, because visibility precedes purchase. A brand losing shelf position will see it in share of search weeks before it appears as a sales decline — and by the time it shows in sales, the competitor who took the position has had weeks to consolidate it.
This makes it an early-warning system rather than a scorecard. A 4-point drop in organic share across your top terms is actionable while it is still a visibility problem. The same information arriving as a sales decline is a recovery project.
It also connects to the broader question of whether you are genuinely gaining ground, which is a market share tracking exercise measured against the full category rather than your own account.
Amazon and Flipkart Measure Differently
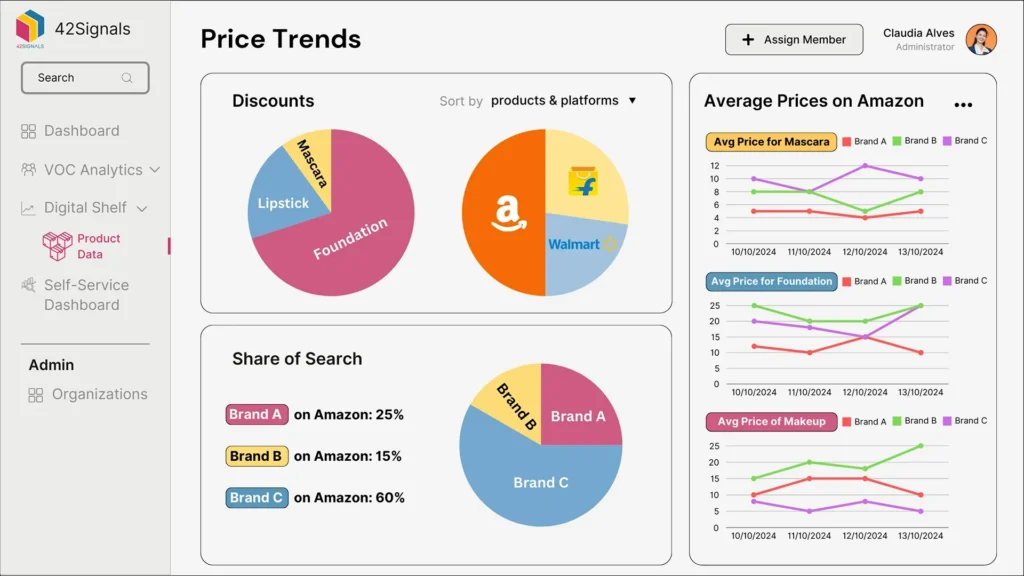
The methodology is the same; the interpretation isn’t.
Amazon Search
Amazon’s ranking weights conversion rate and sales velocity heavily, which makes share of search tightly coupled to availability and price. A stockout removes you from the measure entirely, and rank does not return automatically on restock — you re-earn it with velocity you no longer have.
Practical implication: your Amazon share of search will move with your fill rate. Measuring it without measuring availability alongside produces results you can’t explain. The mechanics of stockouts and rank cover this in detail, and Amazon keyword rank tracking covers the tooling.
Flipkart Search
Flipkart weights direct catalogue and attribute matching more heavily. Listing content quality therefore carries relatively more influence on Flipkart search visibility, and velocity relatively less.
The practical difference: content improvements tend to move Flipkart share of search faster than they move Amazon’s, and rank recovery after an outage is generally quicker. Sponsored density also differs by category, so the organic-to-paid ratio you consider healthy should be calibrated per platform rather than applied uniformly.
What Happens When Everyone Bids: Festive Dynamics
During Big Billion Days and the Great Indian Festival, share of search behaves in ways that break normal interpretation.
Sponsored density rises sharply. More competitors bid on the same terms, so the proportion of the visible page that is paid increases across the category. Your organic share can fall while your organic rank is unchanged, simply because ads pushed organic results further down the page.
This is the most common festive misreading. Before concluding you lost position, check whether the page composition changed.
Your baseline becomes essential. Without three or more weeks of pre-festive measurement, you cannot separate festive movement from category movement, and you cannot tell whether your advertising bought incremental visibility or defended what you already had. Establishing that baseline is a step in our festive season readiness checklist for exactly this reason.
Add the checklist cta here
Competitor stockouts create windows. When a rival’s product goes unavailable, their placements redistribute. Share of search measurement catches this within hours, and it is the highest-value moment to increase bids. Demand is concentrated, and competition for the slot has thinned.
CPC inflation changes the efficiency calculation. The same share of search costs more to buy during peak. A paid share target set on September economics will overspend in October.
Post-window analysis is where the value is. Did your organic share end higher than it started? A brand whose festive sales rose while organic share fell bought volume rather than building position and will start next year from the same place, having paid for the privilege.
42Signals tracks organic and sponsored share of search separately across Amazon, Flipkart, and quick commerce, with the historical baseline to tell genuine position gains from page composition changes.
Common Measurement Mistakes
Blending organic and sponsored. The single most common error, and it hides the most expensive problem.
Including your own brand terms in the core measure. Inflates the number, tells you nothing about category competitiveness.
Using an unweighted keyword average. Lets low-volume terms move a metric that should reflect commercial reality.
Changing keyword set or depth mid-measurement. Destroys trend comparability. Version your keyword set and note the change date when you do revise it.
Measuring nationally on quick commerce. Results vary by pincode. A national average describes an experience no shopper has.
Measuring at inconsistent times. Results shift through the day. Same time daily, or the noise swamps the signal.
Treating it as a scorecard rather than an early warning. The value is the lead time. Reviewing it quarterly discards the thing that makes it useful.
Turning Share of Search Measurement Into Ad Spend Efficiency
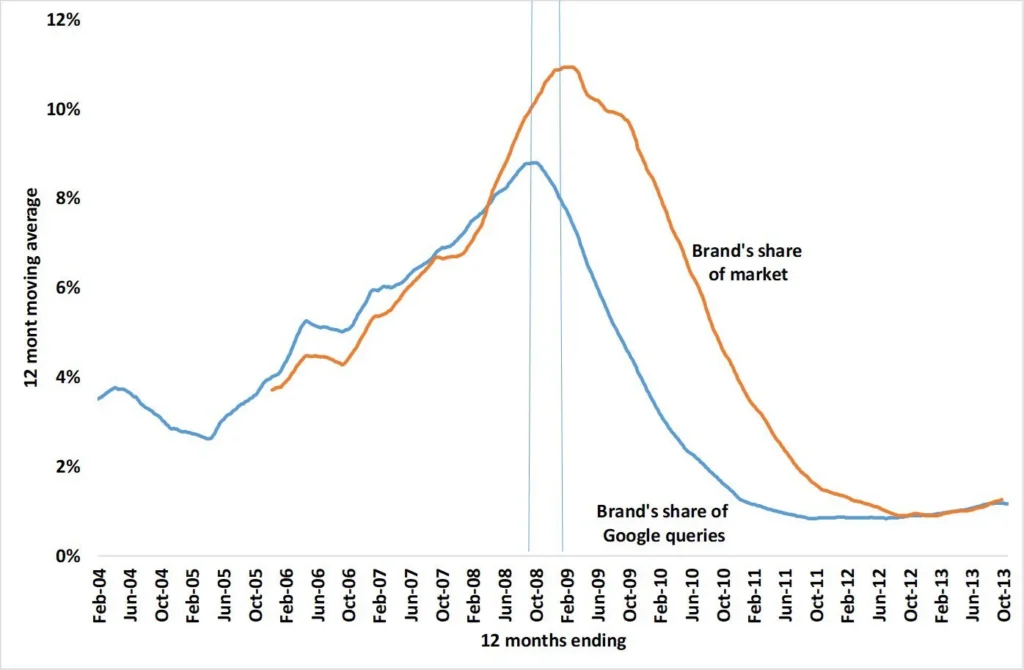
Image Source: TD Reply
Knowing how to measure share of search matters only if the measurement changes a decision. Three that it should:
Where to bid. Concentrate spend on terms where organic visibility is weak, and category volume is high. Terms where you already hold organic position one are the worst use of festive budget, however good the attributed ROAS looks.
When to bid harder. Competitor stockouts and competitor exits from an auction both show up as share of search movement before they show up anywhere else. These are the moments when incremental spend buys disproportionate visibility.
Whether the strategy is working. If organic share is climbing over quarters, listing quality, availability, and conversion are compounding in your favour. If paid share is climbing while organic erodes, you have bought a plateau — and the cost of holding it rises every year as CPCs inflate.
The brands that win first-page visibility during festive windows are not usually the ones who bid hardest. They are the ones who arrived with organic position already built, and used paid placement to extend it rather than to substitute for it.
That distinction is only visible if you measure the two separately. Which is, in the end, the entire argument for doing this properly.
42Signals gives brand and category teams share of search, competitor placement, and availability data across every Indian marketplace, measured at the granularity your shoppers actually experience.
Frequently Asked Questions About Share of Search
What is share of search and how is it calculated?
Share of search is the proportion of visible search results your brand occupies relative to all competing brands, across a defined keyword set. The formula is your brand’s result placements divided by total placements measured, multiplied by 100, measured at a consistent result depth, weighted by search volume, with organic and sponsored placements counted separately. Note that a second, distinct metric also uses this name: brand share of search measures search volume for your brand versus competitors, typically via Google Trends.
Is share of search really a leading indicator of market share?
Research by Les Binet, presented at the IPA’s EffWorks Global 2020, found that brand share of search correlated with market share across automotive, energy, and mobile handsets, and functioned as a leading indicator with lead times up to a year in some categories. Later IPA research by James Hankins across 30 case studies in 12 categories and seven countries found it accounted for roughly 83% of a brand’s market share. Binet cautioned it is not a perfect predictor, since conversion is also affected by price and other factors. That research concerns brand search volume; marketplace shelf-occupancy share of search is a related but distinct metric.
Should I measure organic and sponsored share of search separately?
Yes, and it is the most important methodological decision you will make. A blended figure hides the scenario where paid share rises while organic share falls, meaning advertising is masking a listing, availability, or conversion problem rather than solving it. Separating them also reveals where you are paying to defend terms you already rank first for organically, which is usually the fastest available efficiency gain.
How often should I measure share of search?
Weekly is adequate for most categories outside peak periods. During festive windows like Big Billion Days or the Great Indian Festival, measure daily; the shelf reorganises fast enough that weekly measurement means discovering problems after they have cost you. Measure at a consistent time of day in all cases, since marketplace results shift through the day with stock, pricing, and bidding changes.
Why did my share of search drop during the festive sale?
Often because page composition changed rather than because you lost position. Sponsored density rises sharply during festive windows as more competitors bid, which pushes organic results further down the page. Your organic share can fall while your organic rank is unchanged. Check whether the proportion of the page that is paid increased before concluding you were displaced. This is the most common festive misreading of the metric.
Do Amazon and Flipkart require different measurement approaches?
The methodology is identical; the interpretation differs. Amazon weights conversion and sales velocity heavily, so your share of search there moves closely with availability and price. A stockout removes you from the measure, and rank is re-earned rather than restored. Flipkart weights catalogue and attribute matching more heavily, so listing content improvements tend to move visibility faster there. Calibrate your healthy organic-to-paid ratio per platform rather than applying one target to both.
What keywords should I include in my share of search measurement?
Generic category terms shoppers use when they have no brand in mind, plus high-intent commercial terms with qualifiers like size, variant, or use case. Track competitor brand terms as a separate segment rather than blending them in. Exclude your own brand terms from the core measure. Your share on your own name should be near 100%, and including it inflates the metric while telling you nothing about category competitiveness.