
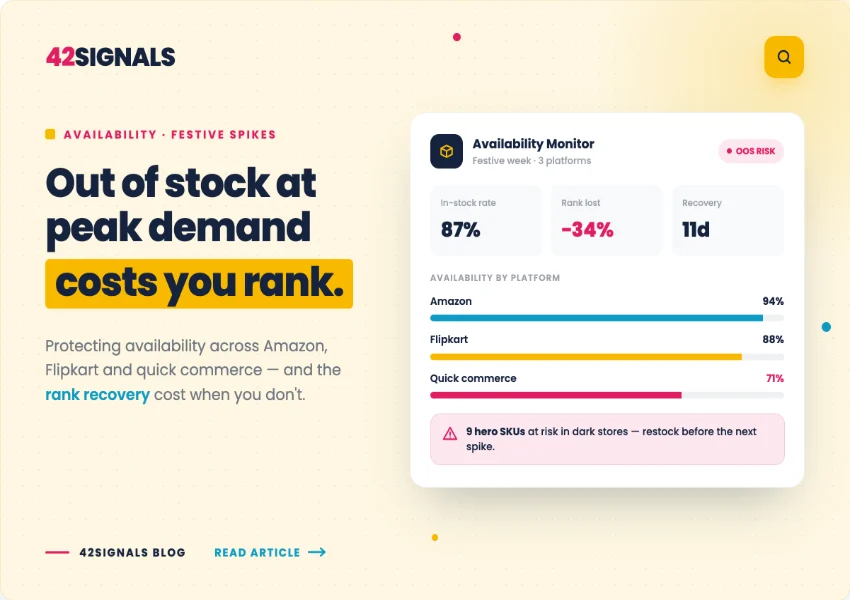
Why Stock Availability During Sale Peaks Costs More Than Lost Revenue
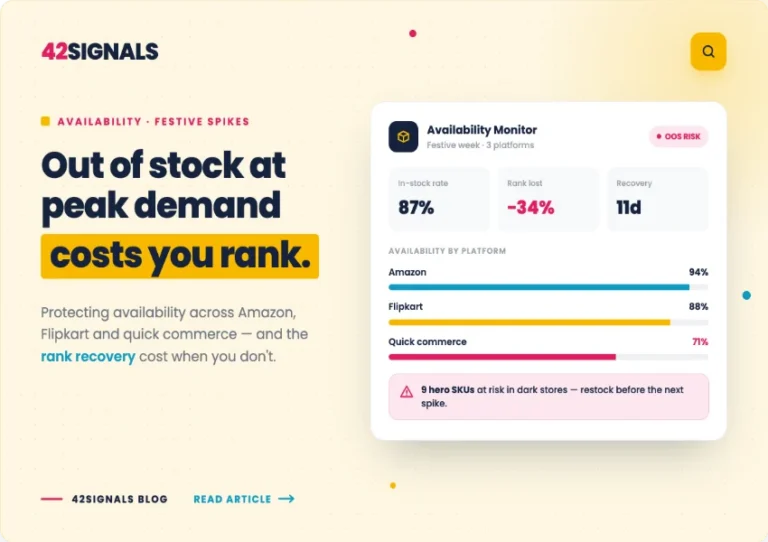
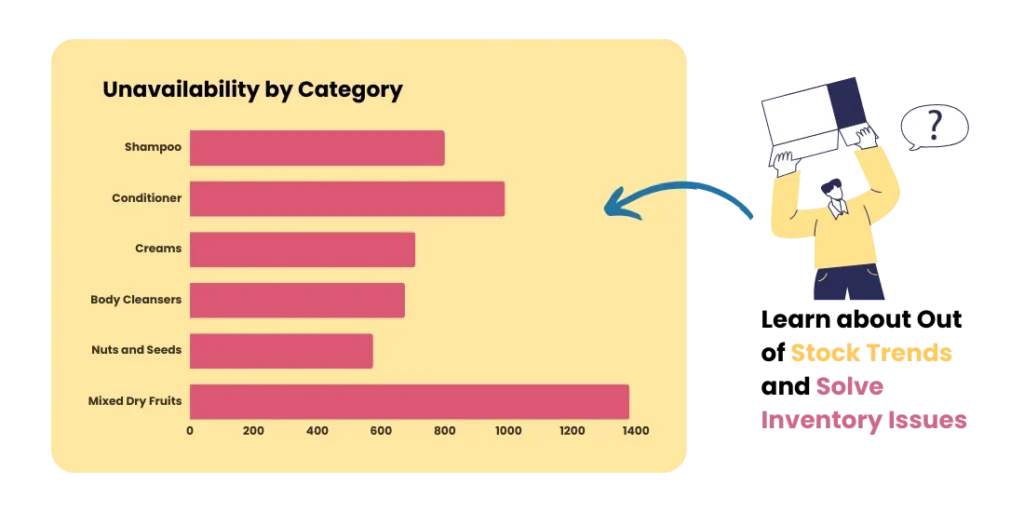
Most brands model a stockout as lost sales. Units you couldn’t ship, multiplied by price. That number is real, and it is the smallest part of the damage. The larger cost is structural. When a product goes unavailable, marketplace algorithms stop showing it — not as a penalty, but because ranking an unbuyable product wastes a slot that could convert. Your position is reassigned to a competitor who can fulfil. When you restock, that position does not come back automatically. You re-earn it with the sales velocity you no longer have because you were invisible. During a normal week, this is an annoyance. During Big Billion Days or the Great Indian Festival, when a quarter of annual category demand compresses into a few weeks, it is the difference between a good year and a missed one. This guide covers what unavailability actually costs, how each platform responds to it, why recovery is slower than the outage, and how to build the monitoring and replenishment discipline that protects both revenue and rank when demand spikes.
What a Stockout Actually Costs
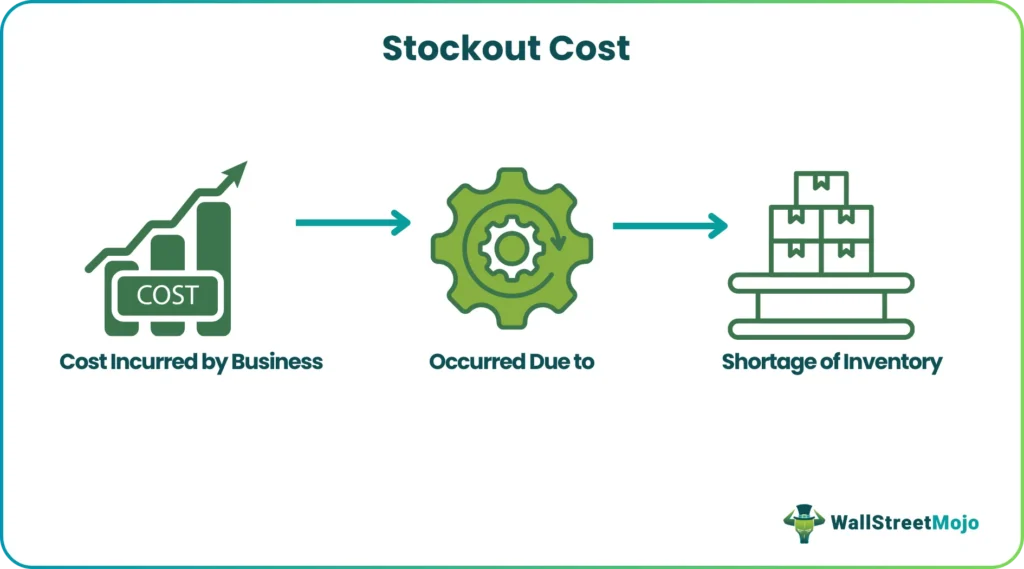
Image Source: Wallstreet Mojo
The cost operates in three layers, and most lost-sales models capture only the first.
Layer One: Direct Lost Sales
Units not sold during the outage. This is straightforward arithmetic and it is what most teams report.
The common error is using average daily velocity. During a peak window, the velocity you lost is peak velocity — frequently several multiples of your baseline. A model built on average rates will understate festive stockout cost substantially.
Layer Two: Rank and Visibility Decay
This is where the compounding happens. Marketplace ranking algorithms weight sales velocity and availability heavily, because both predict whether showing your listing will produce a transaction. An unavailable product fails that test immediately.
As your listing loses placement, the mechanism becomes self-reinforcing: less visibility produces less velocity, which produces less visibility. You exit the outage with a rank position that reflects your outage-period sales, not your pre-outage performance.
Layer Three: Customer and Channel Displacement
A shopper who cannot buy your product does not wait. They buy a competitor’s, and in a category with genuine substitutability, some proportion never come back.
IHL Group, which has tracked this for nearly two decades, defines an out-of-stock as any occasion where a customer arrives ready to buy and leaves without the item for any reason other than price. Their 2026 Inventory Distortion Study puts the global cost of inventory distortion at $1.7 trillion annually — equal to 6.2% of worldwide retail sales — with out-of-stocks accounting for close to two-thirds of that total. Asia-Pacific carries the largest regional share.
Building a Usable Lost Sales Model
A model that captures all three layers:
Direct loss = peak-period daily velocity × days unavailable × unit margin
Visibility loss = the gap between pre-outage rank velocity and post-restock velocity, extended across the recovery period until rank normalises
Displacement loss = an estimate of repeat-purchase value lost, most relevant in replenishment categories where a switched shopper may not return
Precision matters less than consistency. A model that captures the direction and rough magnitude of all three layers is far more useful for investment decisions than a precise number describing only the first.
How Each Platform Responds to Unavailability
Amazon
Amazon’s ranking logic weights conversion and sales velocity heavily. An out-of-stock listing loses Buy Box eligibility, drops out of organic placement, and stops accruing the velocity signal that sustains rank. Advertising against an unavailable ASIN either stops delivering or delivers against a listing that cannot convert.
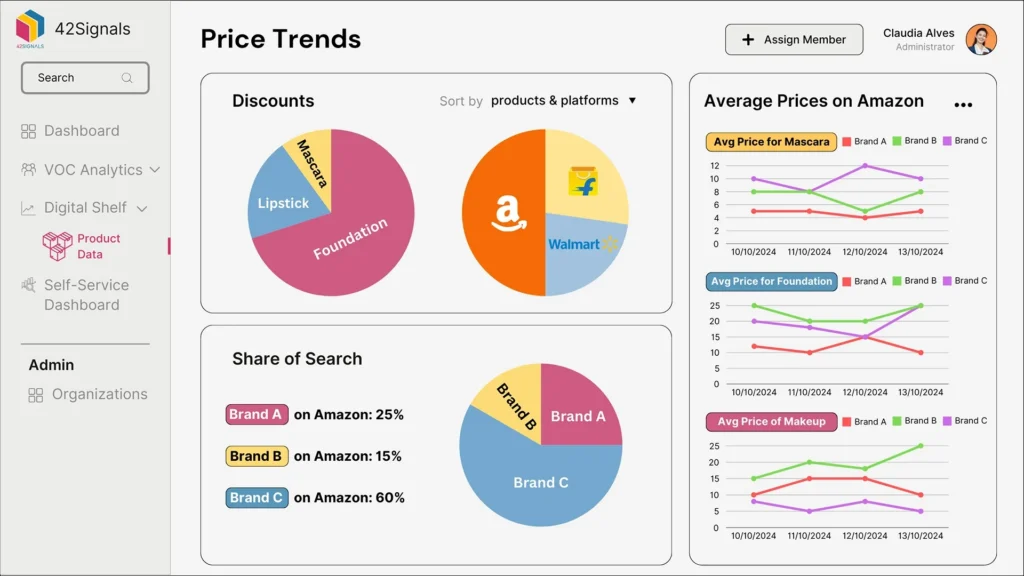
The compounding factor is that Amazon’s algorithm reads recent performance more heavily than historical performance. A strong two-year sales history does not insulate you from a bad week — which is precisely why a festive-window outage is so costly.
Flipkart
Flipkart’s search weights direct catalogue matching more heavily than Amazon’s does, which means listing content carries relatively more weight and velocity relatively less. In practice, this makes rank recovery after a restock somewhat faster than on Amazon.
That is a difference of degree, not of kind. Unavailability still removes you from consideration, and during Big Billion Days the traffic you miss is not recoverable regardless of how quickly rank returns.
Quick Commerce: Blinkit, Zepto, and Swiggy Instamart
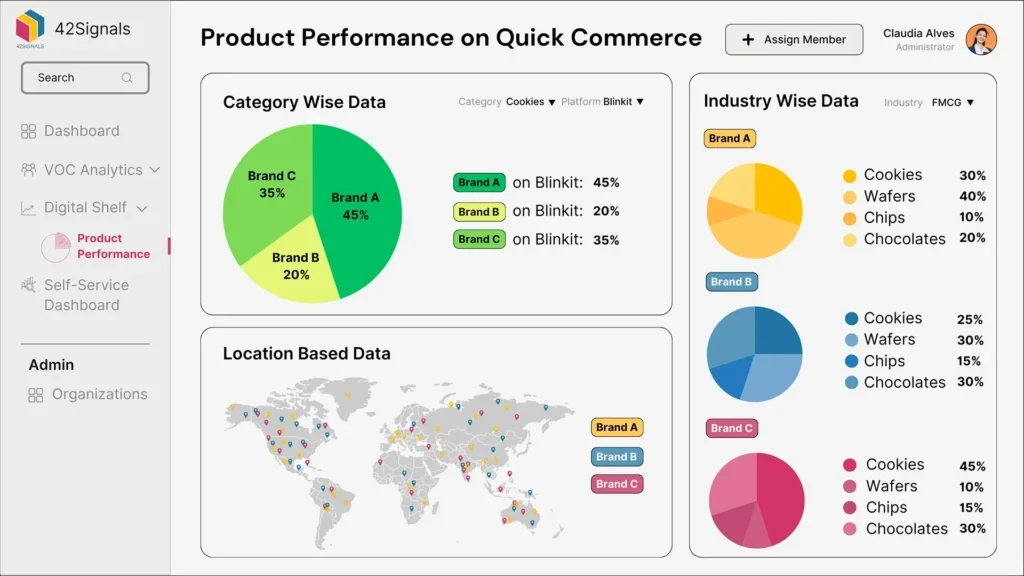
Quick commerce is structurally the most punishing, for three reasons.
The shelf is tiny. Three or four products appear above the fold. Losing a slot is not a demotion — it is disappearance.
Inventory is dark-store level. Stock sits in facilities serving small catchments. You can be fully stocked across a city and unavailable in the two pincodes generating most of your demand.
Demand windows are hours, not days. Festive quick commerce demand concentrates around specific occasions — Dhanteras evening, Diwali morning. An outage during that window is not recoverable by restocking the next day, because the occasion has passed.
This is why national fill-rate reporting is close to useless for quick commerce, a point covered in more depth in our guide to digital shelf availability.
The Recovery Problem
The asymmetry between outage and recovery is the part that surprises teams.
Going out of stock is instant. Rank decay begins within the same trading day. Recovery is gradual, because you have to rebuild the velocity signal that earned your position originally — and you are rebuilding it from a lower-visibility starting point, against competitors who gained ground while you were absent.
Three factors determine how bad the recovery is:
Outage duration. Short outages during low-traffic periods often recover with minimal intervention. Extended outages during peak windows can require sustained advertising investment to rebuild.
Competitive density. In a thin category, your position may still be available when you return. In a dense category during a festive window, someone has taken it and is defending it.
Timing relative to peak. An outage in the week before a sale is worse than one during it, because you enter the highest-traffic period of the year with a degraded rank.
The practical conclusion for festive planning: rank recovery cost should be modelled as part of stockout cost, not treated as a separate marketing problem that appears later.
Why Peak Demand Changes the Arithmetic
Three things break simultaneously during a sale window, which is why stock availability during sale periods needs different handling from business-as-usual availability management.
Velocity multiples compress your safety stock. Cover calculated on average demand evaporates at festive velocity. A SKU with three weeks of cover at baseline may have three days at peak.
Replenishment lead times lengthen. Everyone is replenishing simultaneously. Warehouse throughput, transport capacity, and platform inbound processing all slow at exactly the moment you need them fastest.
The cost per hour of outage rises sharply. The same outage duration costs several times more in traffic terms during a sale than outside one.
Together, these mean festive availability planning cannot be an extrapolation of normal-period planning. It needs its own demand model, its own cover targets, and its own escalation path.
Where National Availability Data Fails
This is the measurement gap that causes most avoidable festive stockouts.
Your ERP reports what is in your warehouses. Platform seller dashboards report product inventory at a regional or national level. Neither reports what a shopper in a specific pincode sees when they search.
Three sources of divergence:
Regional fulfilment gaps. Stock sitting in one fulfilment centre while demand concentrates in another region shows as healthy national inventory and reads as out-of-stock to the shopper.
Dark store allocation. Quick commerce platforms allocate inventory across dark stores independently of your national position entirely.
Listing-level failures. Suppressed listings, pricing errors, and catalogue issues make products unbuyable even when physically in stock. These are invisible in inventory reporting because they are not inventory problems.
The only reliable measurement is checking the shelf as a shopper sees it, at the granularity fulfilment actually happens. Our digital shelf analytics guide covers building that monitoring layer.
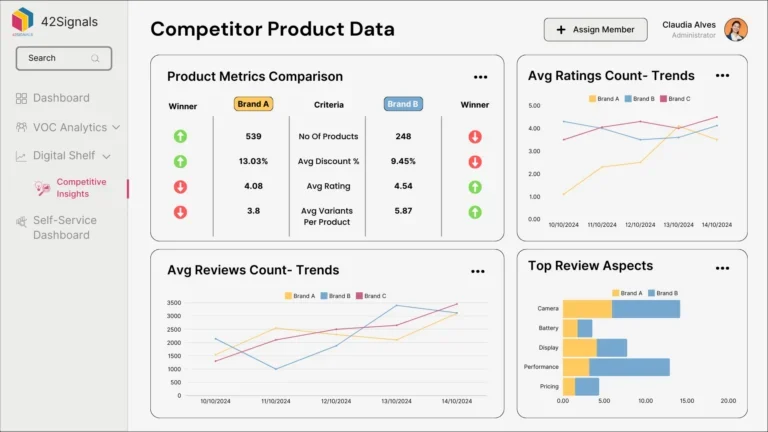
42Signals tracks availability at pincode and dark-store level across Amazon, Flipkart, Blinkit, Zepto and Instamart showing what shoppers actually see rather than what your ERP reports.
Demand Forecasting for Peak Windows
Forecasting for a festive spike is a different exercise from forecasting a normal quarter.
Start from last year’s SKU-level festive uplift, not category averages. Uplift is wildly uneven across a catalogue. The SKUs that spiked hardest last festival are the ones to protect hardest this year.
Layer in causal factors. Planned promotions, competitor activity, platform-level events, and any assortment changes since last year. A SKU that was one of four options in its subcategory last festive may be one of twelve now.
Model by region, not nationally. Festive demand does not distribute evenly. Regional skew determines where inventory should sit, and a national forecast cannot answer that question.
Separate true demand from prior stockouts. If a SKU was unavailable during last year’s peak, its recorded sales understate real demand. Forecasting from suppressed sales data compounds the same error year over year — and identifying that gap is one of the more valuable uses of historical availability data.
Keep human judgement in the loop. Category and sales teams know about a competitor’s launch or a distribution change that no model has seen.
The Replenishment Playbook
Decisions made calmly in advance beat decisions made at 11pm on day two.
Tier your catalogue before the window. Identify the SKUs that will generate the majority of festive volume. These get the highest cover, the tightest monitoring, and first call on constrained replenishment capacity. Not every SKU can be protected equally, and pretending otherwise means protecting none of them well.
Set trigger thresholds, not reorder points. During peak, a conventional reorder point triggers too late. Work backward from replenishment lead time at festive speed — which is longer than your normal lead time — and set the trigger accordingly.
Pre-agree escalation authority. Who can authorise an emergency air freight or an inter-warehouse transfer at midnight, and up to what value? Ambiguity here costs days.
Plan advertising pause rules. When a SKU goes unavailable, advertising against it should stop automatically or within a defined window. This is the cheapest available saving during a stockout and the one most often missed.
Prepare substitution paths. If a variant goes out of stock, can demand be routed to an adjacent SKU? Deciding this in advance retains volume that would otherwise go to a competitor.
Monitoring Cadence During a Sale Window
Daily reporting is too slow when demand compresses. A workable rhythm:
Multiple times daily: fill rate on tier-one SKUs, by region and dark store. These are the products where an hours-long outage is materially expensive.
Daily: full catalogue availability, listing suppressions and Buy Box status, and competitor availability — because a rival’s stockout in a catchment where you are well stocked is the highest-value bid-increase signal available, and it appears nowhere in your own campaign data.
Daily: share of search movement on priority terms. Rank decay shows here before it shows in sales, which buys you reaction time.
Post-window: a full reconstruction of every outage — which SKU, which regions, how long, and what the rank recovery curve looked like. This is the dataset that justifies next year’s inventory investment, and almost nobody builds it.
Protecting Rank, Not Just Revenue, When Demand Peaks
The reason stock availability during sale windows deserves more attention than it usually gets is that its cost is systematically under-measured. Direct lost sales are visible and get reported. Rank decay, visibility loss, and the advertising spend required to rebuild position appear in different reports, owned by different teams, weeks later — and are rarely connected back to the outage that caused them.
That accounting gap is why availability investment is chronically underfunded. The supply chain team is judged on inventory efficiency, the marketing team on ROAS, and nobody owns the number that connects them.
Three things change the outcome. Model the full cost of unavailability across all three layers, so the investment case reflects reality. Measure availability at the granularity fulfilment actually happens — pincode and dark store, not national. And build the monitoring cadence and escalation authority before the window opens, because during a festive spike there is no time to design a process.
Stockouts will still happen. The brands that come out of a festive window with their rank intact are the ones that detected them in hours rather than days, stopped advertising against them immediately, and had already decided who could authorise the fix.
42Signals gives supply chain and category teams shared visibility into availability, competitor stock position, and share of search across every Indian marketplace and quick commerce platform.
Frequently Asked Questions About Stock Availability During Sale Periods
How much does a stockout actually cost during a festive sale?
More than the lost units, in three layers. Direct lost sales calculated at peak velocity rather than average velocity. Rank and visibility decay, since marketplace algorithms deprioritise unbuyable listings and the position is re-earned rather than restored. And customer displacement, where shoppers switch to a competitor and some proportion do not return. IHL Group’s research puts global inventory distortion at $1.7 trillion annually, with out-of-stocks accounting for close to two-thirds of it.
How long does it take to recover search rank after a stockout?
It depends on outage duration, competitive density in your category, and how close the outage was to a peak window. Recovery is always slower than the outage itself, because rank is rebuilt by re-earning sales velocity from a reduced-visibility starting point, against competitors who gained position while you were absent. Outages immediately before a sale are the most damaging, since you enter the highest-traffic period with degraded rank.
Why does my product show as in stock in my ERP but out of stock to customers?
Three common causes. Regional fulfilment gaps, where inventory sits in a fulfilment centre serving a different area than where demand is. Dark store allocation on quick commerce, where platforms distribute stock across facilities independently of your national position. And listing-level failures such as suppressions or pricing errors that make a product unbuyable despite being physically in stock. None of these appear in inventory reporting, because only the first is an inventory problem.
Should I pause advertising when a product goes out of stock?
Yes, and automatically where possible. Advertising against an unavailable product spends budget on impressions that cannot convert, while the resulting poor conversion rate signals reduced relevance to the platform and raises your cost per click afterward. Defining pause rules before a sale window, rather than reacting manually, is the cheapest saving available during a stockout.
How do I forecast demand for a festive sale window?
Start from SKU-level uplift in last year’s festive period rather than category averages, since uplift varies enormously across a catalogue. Layer in causal factors including promotions, competitor activity, and assortment changes. Model regionally, because festive demand skews geographically and national forecasts cannot tell you where to position inventory. Critically, adjust for SKUs that went out of stock last year — their recorded sales understate real demand, and forecasting from suppressed data repeats the error annually.
Why is availability harder to manage on quick commerce?
Because inventory sits in dark stores serving small catchments, availability varies within a single city — you can be well stocked citywide and unavailable in the specific pincodes driving your demand. The visible shelf is also far smaller, typically three or four products, so losing a slot means disappearing rather than being demoted. And festive demand on these platforms concentrates into windows of hours around specific occasions, which restocking the following day cannot recover.
What should I track during a sale to protect availability?
Fill rate on your highest-volume SKUs multiple times daily, broken out by region and dark store. Full catalogue availability, listing suppressions, and Buy Box status daily. Competitor availability daily, since a rival’s stockout where you are well stocked is the best bid-increase signal available and appears nowhere in your own reporting. And share of search movement, which shows rank decay before sales data does and buys you time to react.